Category Archives: Global

In an unpredictable building market where budget bottom lines are often unwavering, it’s not uncommon for a contractor to have to choose between a product’s cost and its performance. Insulation, as one of the last elements to be installed, is commonly the first place builders look to cut corners. That short-term cost savings usually results in long-term energy loss and increased expenses for the building’s owner.

Whether you specify building materials or manage product installation, there are several important considerations when determining which insulation is the best fit for each project.

Considerations for Specifiers

When selecting insulation for a project, important factors to take into account include the property’s location and climate; the building materials, e.g., metal or concrete; and any environmental qualifications that need to be met. All these factors, including code requirements, must be considered before narrowing down which product options will provide the best performance, and ultimately the best value, for the project.

Climate. In warmer climates where humidity may lead to extra moisture around pipes, choose the proper insulation for the climate and the system’s conditions to ensure ultimate thermal efficiency and prevent mold growth. In colder environments, proper insulation selection can prevent heat loss and cold air penetration, helping reduce energy loss. Paying attention to these elements can save building owners from unnecessary headaches and ensure the property is built to run as efficiently
as possible.

Metal versus Concrete. After taking climate into consideration, examine what other materials are already in play, since those can greatly influence the type of insulation needed. Metal acts as a conductor to draw in warmth or coolness, so buildings made of steel often require an insulation that can deliver maximum thermal performance and vapor control to minimize the risk of concealed condensation on pipes or interior walls.

Concrete, on the other hand, is a porous material with a lot of mass, so it acts as a thermal and moisture “capacitor.” Therefore, both moisture protection and the bulk of the insulation should be on the exterior. One way to accomplish this is with a closed-cell insulation.

Since the building’s interior does not experience the same temperature and humidity fluctuations as the exterior, consider at least a minimal amount of thermal insulation for noise control and to keep the interior wall surface at a consistent temperature.

Green Building Certifications. Another important consideration is whether a property needs to qualify for LEED certification, with its stricter building and material requirements. Whether the focus is on air handling or general building insulation, chances are a product is available to help support LEED certification requirements. Regardless of certification status, materials must at least meet minimum energy efficiency and thermal demand requirements. To make this selection process more seamless, some manufacturers will identify which materials support overall LEED certification and even which products will deliver the best results for the biggest value.

Budget versus Performance. Once a building’s location, purpose, and other factors have been reviewed, work with the manufacturer to determine which products meet the project’s performance and budget requirements. Too often, material options are determined based on the budget alone. Selecting less expensive materials or reducing insulation may provide short-term savings, but it often doesn’t reduce overall costs. For example, while using less insulation may cut a little of the overall budget, it can reduce a building’s energy efficiency by half, which increases heating and cooling costs—even doubling this expense!

Proper installation is easier and more cost effective than a retrofit to fix problems such as deteriorating systems that resulted from improper insulation amounts or material selection. Examining all a building’s requirements and conditions before identifying the insulation products to be incorporated will help prevent the need for short-term product replacement and ensure the property’s long-term efficiency.

Considerations When Building

It can be difficult being responsible for completing construction on time and on budget. The practice of “value engineering” is increasingly common as contractors race to meet clients’ budget limitations in a highly competitive market. However, if a material is switched out or installed improperly due to cost or time concerns, the overall efficiency and performance of a building can be compromised.

Thickness Changes. One of the most common mistakes made during the installation process is cutting back on the thickness of material (e.g., installing 1-in.-thick versus the recommended 1.5-in. thickness). While in this example half an inch may not seem like a big difference, reducing the thickness of the recommended product can alter how an entire building operates.

Removing or reducing the insulation on a building’s heating or cooling ducts requires the entire HVAC system to work harder. So while the cost of insulation may have been cut on the front end, the building’s equipment is working harder to maintain the internal temperature. When the HVAC system has to perform at a higher level than designed, the risk of system failure also increases. This means greater operating costs and energy expenditures after construction is complete. Poor duct insulation can also result in uneven temperature pockets throughout the entire building, a consequence of value engineering that will affect a building’s occupants for years.

Avoid Damage During Installation. Improper installation of the specified material is another common mistake during the construction process. Compressing or stretching insulation compromises performance, resulting in decreased efficiency and an increased risk of problems. Compressing insulation reduces its R-value and the overall thermal performance of the assembly. In the same way, trying to stretch the insulation in length, width, or depth can negatively impact the R-value and is likely to result in gaps in the insulation. For best results, the insulation should completely fill the cavity space with no compression, gaps, or voids. In addition, any utility or other penetrations through the assembly or cavity should be sealed with an air-impermeable and, when required by code, qualified fire-blocking material.

While real estate sales and new building projects remain slow, finding innovative and easy ways to reduce construction costs will remain top of mind. Providing adequate training and education throughout the building process about the benefits of a fully insulated system with the right type of materials will help clients, project managers, and those working on site weigh cost savings benefits against potential consequences that may impede the building’s efficiency and performance.

For more information or to learn more about the importance of proper insulation material selection and installation, contact your local insulation manufacturer or visit www.insulation.org/membership.

The National Insulation Association (NIA) emphasizes the need to provide a safe workplace to its members, affiliates, and employers in any industry related to mechanical insulation. NIA’s Board of Directors and its Health and Safety Committee have not only instituted a safety award recognition program, but also hold two Safety Roundtables each year to provide members and guests an opportunity to discuss best practices in safety and to learn about new and proposed laws and regulations that affect all employers.

The most recent Safety Roundtable was held at NIA’s Annual Convention in Tucson, Arizona, in March 2011. Attendees shared their best practices to provide a safe workplace for their employees, and they also learned about current and planned actions by regulatory agencies to ensure employer compliance with safety laws and regulations.

Everyone’s Concern

Safety is everyone’s concern. All employers and employees in the mechanical insulation industry need to take safety seriously, whether they are contractors, manufacturers, or end users.

Safety has a definite impact on a company’s bottom line. An unsafe workplace, unsafe employees, or an unconcerned employer can have a direct connection to on-the-job injuries, together or individually. While it is difficult to calculate the exact cost of an on-the-job injury, it has been estimated that for every dollar an injured employee receives in workers’ compensation, his/her employer spends $11.00 in associated costs. These additional costs can include increased workers’ compensation insurance premiums, loss of production, loss of quality, OSHA fines, legal fees, and other cost factors.

Employers attending the Roundtable shared their ideas for best practices regarding safety audits, safety programs, and the methods they use to ensure compliance with their own safety rules and regulations. One of the safety award winners commented that it is important for a company to practice what it preaches. It is one thing to have a “good-looking” safety program; it is another thing to implement all aspects of that program. Frequently, the company’s president and other members of upper management must demonstrate a real commitment to the company’s safety program to get all employees to take the program seriously.

This safety award winner provides incentives to employees found to be in compliance with the company’s safety rules and regulations and also uses progressive discipline for employees who refuse to get the safety message. In doing this, the company feels that its employees know it is taking safety seriously. The incentives—as well as discipline—should be available to all employees, no matter their position.

Hazard Training

All safety award winners share the belief that training on safety is not a “one-time” activity. Daily, weekly, and quarterly reinforcement of safety education and hazard recognition is important for both fixed-site employers and construction contractors. One of the most important areas in which to educate employees is hazard recognition. Not only is this area aggressively enforced by OSHA, but it can also result in real injuries and costs to the employer if not emphasized. Not every safety hazard is covered by an OSHA safety standard, nor can every company anticipate every hazard to which its employees might be exposed. Employees must be trained on how to recognize and identify hazardous situations in the workplace and then be instructed how to address them.

All employers should perform daily safety job briefings. The immediate supervisor of each group of employees should take a few minutes before presenting the daily job briefing to consider the work to be performed that day and the hazards to which employees might be exposed. During the daily job briefing, employees should be acquainted with these potential hazards and advised of ways to deal with them. Of course, even a supervisor cannot anticipate everything that might happen, which is why the training on hazard recognition is so significant. These job briefings can be adapted for fixed-site employers as well as construction industry employers.

Weekly toolbox or tailgate safety meetings addressing particular safety topics are also extremely important. These weekly safety meetings give the employer an opportunity to reemphasize and reeducate employees in the safety knowledge they were provided when first hired by the company. Repetition of important topics is encouraged. The topics should reflect the work environment and hazard exposures of the employees receiving the training.

Initial Safety Training

One of the other areas discussed at the Safety Roundtable was the initial safety training received by employees when hired. This training should be very broad based and detailed. The initial safety training for new employees is not something that can be accomplished in 15 minutes or even an hour. The employer should take as much time as necessary to effectively educate all new employees in all safety areas that will impact the work they are being hired to perform. Employees should also be trained concerning safety for areas that may only indirectly touch upon the employee work area.

Safety training is not accomplished by giving the employee a copy of the company safety manual and telling him/her to take it home and read it that evening. The best safety training is hands-on. If that is not possible, in-person safety training is the next best thing. Computer-based safety training can be acceptable and effective if it is interactive and gives the employee the opportunity to ask questions and receive answers about the information being imparted.

Under no circumstances should employees be exposed to any safety hazard, whether physical or chemical, without first receiving adequate safety training about the hazard and how to avoid potential injuries from it.

Measuring Knowledge and Compliance

Following training, an employer must measure its impact on the employee, either by the trainer’s observation of the employee performing his/her tasks safely or by testing to measure the amount of knowledge accrued. If the employee does not have sufficient knowledge on the topic presented, the employee should be retrained before being exposed to that hazard. Supervisory employees at any level should be trained to observe employees for not only the quality and efficiency of their work, but also their safety compliance.

This is especially true for employees designated as competent persons on construction sites. The competent person designation is being emphasized by OSHA in construction site compliance inspections. This is not a designation to be taken lightly. Be sure the individuals you intend to designate as competent persons have been trained on their responsibilities and the authority they have to ensure a safe worksite.

Employees who do not comply with company safety rules should be subject to progressive discipline. Any employee who does not comply with a safety rule or safety guideline or who is observed not following company procedures regarding safety should be retrained on that area of their work, following the appropriate discipline.

Companies that effectively train their employees, monitor and audit their safety performance, and identify new safety hazards and take immediate corrective action will see a reduction in their on-the-job injury rates and a respective reduction of their workers’ compensation Experience Modification Rating (EMR). These employers also are much less likely to be significantly penalized by OSHA during a compliance inspection (see “OSHA Changes Are Coming—Or Here”).

Keeping Current on Safety

Several Safety Roundtable attendees praised the opportunity to share their ideas as well as receive information from other contractors and manufacturers. As some attendees indicated, “you don’t know what you don’t know.”

To stay current on safety issues and solutions, consider sending someone to attend informational or educational sessions about safety at NIA’s Annual Convention or Committee Days. No matter how well educated you are in safety, NIA provides the opportunity to expand and increase your knowledge.

Keeping up with changes in Occupational Safety and Health Administration (OSHA) regulations is critical for all construction firms, including those in the mechanical insulation industry. Changes in the OSHA Field Operations Manual that Dr. David Michaels, OSHA Administrator, announced in spring 2010 affect all employers. Pending legislation may also affect the construction industry. Following are some of the most critical issues.

Increased Penalties

Changes to the OSHA penalty structure were made with the goal of increasing the average penalty for citations. These changes in the Field Operations Manual were put into effect by most OSHA area offices in October 2010.

It appears OSHA felt the average penalty had decreased to such a low level that employers were not taking penalties seriously. This author has counseled some employers who indicated that rather than spend money to get into compliance, they prefer to take their chances on getting caught. They felt that the low potential cost of fines, even with possible attorney fees, were worth saving the cost of compliance for a few years^#151;or forever. OSHA is trying to send the message that it is no longer a good business decision to work out of compliance and unsafely.

This author has been seeing a significant increase in penalties, even for “first-time offenders.” For example, one employer is faced with fines for two serious violations in the amount of $12,600. Past experience with this employer indicates that at this time last year the penalties for these same violations would have been no more than $6,000.

One of the most significant changes is a mandate that OSHA Area Directors are restricted in their ability to negotiate penalty reductions and OSHA fines at the informal conference level to 30 percent of the proposed penalty. In other words, employers can no longer go into an informal conference with the idea that they are going to negotiate the penalty down to ten cents on the dollar.

In addition to this change, Dr. Michaels also modified the initial reduction for size an employer can receive in the calculation of the assessed penalty. In the past, an employer with fewer than 25 employees enjoyed a 60 percent reduction of the initial assessed fine; that reduction has changed to 40 percent. Other size-based penalty reductions have been modified respectively.

Since the changes in the Field Operations Manual went into effect, there has been a definite change in how OSHA establishes the initial assessed penalty. Before October 2010, OSHA fines usually began at $5,000 or lower for a serious violation, prior to any size, good faith, or history reductions. Now these fines are more likely to be initially assessed at $7,000 per violation. In addition, for purposes of determining whether an employer is entitled to a reduction for a good history, the period to be considered has been increased from 3 to 5 years. The employer can still receive a 10 percent reduction if it has no serious, repeat, or willful violations within the preceding 5 years, but now it can receive a 10 percent increase in the initial fine if it has had one of these types of citations within that same period.

As a result of these changes alone, many trade associations are taking a new, serious look at the safety and health area as one in which they need to provide education and advocacy for their members.

Injury and Prevention Programs

In addition, OSHA continues to move forward with establishing a standard that will require employers to institute injury and illness prevention programs. Dr. Michaels has announced that the intent is to “make employers set goals” in workplace safety. The proposed standard will set broad components for leadership and employee participation, planning, implementation, evaluation, and management review of safety rules and compliance.

In other words, this standard will require employers to do what they should already be doing. But after the standard is adopted, OSHA will be able to cite and fine them for not helping themselves.

Proposed Penalty Increases and Protected Class Expansion

At the legislative level, the Protecting America’s Workers Act was reintroduced in Congress in early January 2011. This rather sweeping legislation will significantly affect all employers and how they address safety issues. The Act proposes significantly higher penalties for all safety violation categories and significantly increases potential prison time for willful violations involving death. It also establishes a new category for a criminal willful violation when serious injuries result from the failure to comply. The definition proposed for serious bodily injury is very broad; under the workers’ compensation laws in many states, it would include just about any physical injury or occupational illness that has a psychiatric overlay.

In addition to the significant increase in civil and criminal penalties, the Act also increases whistleblower protection, expanding the protected class to include employees who report on-the-job injuries. It appears the theory is that an employee cannot be injured without being exposed to a hazard, so an employee reporting an on-the-job injury or illness is indirectly reporting a safety hazard. Thus, it could be argued that any action against such an employee was taken because he/she reported a safety or health hazard.

Proposed Abatement Timeline Changes

Another significant component of this proposed legislation, in addition to substantial victim’s rights language, would require employers to abate safety and health violations while contesting the alleged violation. So an employer, even while arguing that no safety or health violation existed, would be required to expend resources to correct situations a compliance officer has alleged are violations of an OSHA standard or the general duty clause, regardless of whether such violations actually exist.

Because alleged safety and health violations typically have short proposed abatement periods, most employers would have to file petitions to modify abatement dates in a separate action while challenging the substance of the citations issued. The abatement modification proceeding would go forward well in advance of any hearing on the merits of the subject citations.

This legislation could significantly increase the caseload of the Occupational Safety and Health Review Commission by forcing it to adjudicate not only the substance of the citations issued, but also the employer’s request to extend the abatement period to correct the alleged violations while its challenge to the underlying citation is proceeding. Likewise, by adding a separate series of pleadings, the employer’s legal costs could increase significantly.

The abatement period change in the Protecting America’s Workers Act is already moving forward in some states that have state approved OSHA programs. In April 2011, the governor of the state of Washington signed legislation that will put into effect an abatement requirement for employers who challenge citations issued by Washington OSHA. This legislation is to go into effect 90 days after the Washington state legislature adjourns, which was April 24, 2011. Washington OSHA will move immediately to promulgate regulations to implement this new legislation, which appears to mirror the abatement language in the Protecting America’s Workers Act.

Discrimination Concerns

In addition to the legislation moving forward, employers are noticing an increase in OSHA discrimination cases filed by employees. Employers must move very carefully when taking disciplinary action against employees who have brought a safety or health concern to the attention of management. While such action by an employee should not impede the employer from proceeding under its disciplinary action program for violation of any work rules, employers are cautioned to carefully document all unacceptable actions by the employee leading up to any disciplinary action.

Employers are also cautioned that in many area offices, OSHA currently considers the reporting of an on-the-job injury or illness as protected activity under Section 11(c) of the Occupational Safety and Health Act, which prevents discrimination against employees who report safety or health concerns to their employers. Note to all employers: be sure management personnel are very careful about what they say in electronic communications of any kind, including e-mails, text messages, and comments on social media such as Facebook, LinkedIn, and Twitter accounts. Sarcastic comments, as well as innocent discussions between management personnel concerning employees, can be brought to the attention of OSHA discrimination compliance officers. This may adversely affect a company in any OSHA discrimination proceeding, including its ability to reasonably negotiate a resolution prior to going to a formal trial.

Residential Fall Protection

One other step recently taken by Dr. Michaels from an administrative standpoint was to eliminate the interim standard for residential fall protection, which had been in place from shortly after the implementation of OSHA’s current fall protection standard. This interim fall protection policy was implemented to relieve employers engaged in residential construction from some of the requirements of the OSHA fall protection standard. Dr. Michaels determined that this policy was no longer necessary in light of advances in all forms of fall protection, and in December 2010 he announced that the interim policy for fall protection for residential construction would be withdrawn as of June 16, 2011. This is important for any employers who have ever used the interim policy as part of the implementation of their own fall protection program. Region VII of OSHA has already established a regional emphasis program to enforce this change

.

Keeping Up with OSHA

As OSHA regulations and policies continue to evolve, it is critical that all companies keep up to date on what is required of them. One way to do this is to participate in the National Insulation Association’s Safety Roundtables, held at its Annual Convention each spring and Committee Days meeting each November. For more information, visit www.insulation.org.

March 23, 2011, was the 1-year anniversary of the Patient Protection and Affordable Care Act, better known as health care reform. Despite having lived with this monumental legislation for more than a year, there still seem to be more questions than answers. This article addresses some of those questions.

How We Got Here

To begin to understand health care reform, one must first understand the “why.” Our country has struggled with this issue for a very long time. In 1912, President Theodore Roosevelt was the first to campaign on a platform that promised national health insurance. He was defeated by Woodrow Wilson.1 Efforts to improve on or create a national health care system were called for again in 1932 by the Committee on the Cost of Medical Care, in 1934 by President Franklin Roosevelt’s New Deal, by President Harry Truman in 1945, in 1962 by President John F. Kennedy, in 1972 in the Nixon/Kennedy debates, and later by the Carter, Reagan, and Clinton administrations.

But one really only needs to look back over the past 10 to 20 years to understand the need. In 1999, the average premium for small firms was $6,683. In 2009, it had grown to nearly $13,000.2 Over that same period, employees’ earnings grew 37 percent, while employee health care costs grew 137 percent.3 We have achieved what has been called an “affordability gap.”

The Affordability Gap

What caused this disparity? The factors are numerous. The U.S. government spent $2.3 trillion on health care in 2009, more than three times the $714 billion spent in 1990, according to the Kaiser Family Foundation.

It’s generally accepted that medical technology and innovation have been a driver. Not only have the types and variety of medical and pharmaceutical services increased dramatically, but so has patients’ ability to learn about and access these technologies.

Administrative inefficiencies have been cited. The current system suffers from a lack of coordination—for example, each payer generally has its own billing system. This is further aggravated by a payment system that tends to pay by tests or exams ordered instead of the outcomes achieved.

Health insurance mandates make an impact. A mandated benefit is a law that requires a health insurance company or policy to cover specific providers, procedures, benefits, or people. The Council for Affordable Health Insurance estimates that mandates can increase the cost of an insurance policy from 10 to 50 percent.

Other factors often recognized include our aging population and cost shifting from public to private payers and from the uninsured to the insured. The legal environment contributes in the form of rising medical malpractice premiums.

All things considered, however, perhaps the best indicator of what may be driving health care cost increases is the negative trend in certain health indicators over the last 20 years, including the following.

  • In 1991, 7.2 million Americans had diabetes. Today, the number is estimated to be 23.6 million.
  • Twenty years ago, 12 percent of the country was obese. Today, it is nearly 26 percent.
  • Since 1980, obesity prevalence among children and adolescents has almost tripled.
  • It’s estimated that the lifetime likelihood of developing diabetes for children born in 2000 is:
    • 26.2 percent for male and 31.2 for female whites
    • 40.2 percent for male and 49 percent for female blacks
    • 45.4 percent for male and 52.5 percent for female Hispanics.4

The Health Care Environment

Only 64 percent of employers offer health benefits to their employees. (This can be as low as 39 percent for employers who have many lower-wage or part-time workers.)5 In 2010, the Census Bureau estimated that more than 50 million Americans are uninsured. There was a significant increase over the last couple of years, which is blamed on rising costs, the recession, companies dropping employee health insurance benefits, and families going without coverage to cut costs.

Many who find themselves uninsured have access to some form of safety net. Generally referred to as risk pools, these programs allow individuals denied coverage by private insurance companies to access state-sponsored health insurance plans—albeit at a higher cost than if they were able to qualify for a private plan. Currently, 34 states offer some form of risk pool, and these risk pools cover about 183,000 people.

Risk pools come in a variety of forms. They can be a temporary stopping point for individuals who are denied health coverage, or they can be a catch-all for those who have no other way to purchase insurance. Some risk pools have done an excellent job of providing alternatives, while others have done very little because their health insurance plans are not designed well, are not funded properly by their states, or are simply unaffordable.

Summing It All Up

The Kaiser Family Foundation has estimated that by 2019 family premiums will cost between $24,000 to $30,000. When you take all this into consideration—the rising costs, the negative health indicators, the decreasing numbers of employers offering health insurance, the rising uninsured population, the inconsistent success of risk pools, etc.—it leads to only one conclusion: We had a problem.

Where We Are Today

Health care reform is really a combination of two pieces of legislation: the Patient Protection and Affordable Care Act passed on March 23, 2010, and the Health Care and Education Reconciliation Act of 2010, passed March 30, 2010. The signed legislation contained over 2,400 pages before clarifications, rulings, or determinations were made by the various governmental departments tasked with defining and enforcing it.

Some features of health care reform should already be familiar, as many have already gone into effect. Others may or may not apply, depending on whether one has “grandfathered” status.

What is a Grandfathered Plan?

Grandfathered plans are the group health plan or health insurance coverage in which an individual was enrolled on the date of enactment of health care reform legislation. Certain health care reform provisions don’t apply to grandfathered plans. For a plan to lose its grandfathered status, it must incur a change that is not permitted. Examples may include:

  • Significantly reducing benefits or contributions
  • Significantly raising co-payment charges or deductibles
  • Raising co-insurance charges
  • Adding or tightening annual limits

Understanding the Reform Timeline

Health care reform covers a scope of topics that far exceeds what the media covers. That scope also exceeds what is practical to include in this article. The Kaiser Family Foundation has created an interactive tool designed to explain how and when all provisions of the law will be implemented at http://healthreform.kff.org/timeline.aspx.

Below is a brief outline of the topics and provisions implemented or scheduled each year. Topics that may be of interest to the business community include:

  • Expanded Insurance Coverage: Health care reform contains some provisions designed to improve access to health care coverage.
  • Health Insurance Reform: Health insurance issuers are required to reform certain insurance practices and improve the coverage available.
  • Health Plan Administration: Health plans will be subject to increased administrative duties under health care reform.
  • Fees and Taxes: With a total estimated cost of more than $900 billion dollars, the reform of the nation’s health care system comes with additional costs and fees. These fees will also be implemented over the next several years. However, health care reform also includes some subsidies, in the form of tax credits, to help individuals and businesses pay for coverage.

2010 Provisions

Expanded Insurance Coverage

  • Extended coverage for young adults: Group health plans and health insurance issuers offering group or individual health insurance coverage that provide dependent coverage of children must make coverage available for adult children up to age 26. There is no requirement to cover the child or spouse of a dependent child. This requirement applies to grandfathered and new plans.
  • Access to insurance for uninsured individuals with pre-existing conditions
  • Identifying affordable coverage: As required, the Secretary of Health and Human Services has established a website through which residents of any state may identify affordable health insurance coverage options in that state at www.HealthCare.gov.
  • Reinsurance for covering early retirees

Health Insurance Reform

  • Eliminating pre-existing condition exclusions for children
  • Coverage of preventive health services
  • Prohibiting rescissions
  • Limits on lifetime and annual limits

Health Plan Administration

  • Improved appeals process
  • Nondiscrimination rules for fully insured plans: Fully insured group health plans will have to satisfy nondiscrimination rules regarding eligibility to participate in the plan and eligibility for benefits. These rules prohibit discrimination in favor of highly compensated individuals. This section does not apply to grandfathered plans. This provision was set to take effect for plan years beginning on or after September 23, 2010, but has been delayed indefinitely pending the issuance of regulations. The regulations will specify the new effective date.

Fees and Taxes

  • Small business tax credit: The first phase of the small business tax credit for qualified small employers began in 2010. These employers can receive a credit for contributions to purchase health insurance for employees. The credit is up to 35 percent of the employer’s contribution to provide health insurance for employees. There is also up to a 25 percent credit for small nonprofit organizations. When health insurance exchanges are operational, tax credits will increase, up to 50 percent of premiums.
  • Indoor tanning services tax: One additional tax imposed by the health care reform law is a 10 percent tax on amounts paid for indoor suntanning services.

2011 Provisions

Expanded Insurance Coverage

  • Voluntary long-term care insurance options Health care reform creates a long-term care insurance program for adults who become disabled. Participation will be voluntary, and the program is to be funded by voluntary payroll deductions to provide benefits to adults who become disabled. Although the program was technically effective January 1, 2011, significant portions are not required to be established until 2012.

Health Plan Administration

  • Improving medical loss ratios: Health insurance issuers offering group or individual health insurance coverage (including grandfathered health plans) must annually report on the share of premium dollars spent on health care and provide consumer rebates for excessive medical loss ratios.
  • Standardizing the definition of qualified medical expenses: The definition of “qualified medical expenses” for Health Savings Accounts (HSAs), Flexible Spending Accounts (FSAs), and Health Reimbursement Accounts (HRAs) must conform to the definition used for the itemized tax deduction. This means that expenses for over-the-counter medicines and drugs may not be reimbursed by these plans unless accompanied by a prescription.
  • Cafeteria plan changes
    Fees and Taxes
  • Increased tax on withdrawals from HSAs and Archer Medical Savings Accounts (MSAs): The additional tax on HSA withdrawals prior to age 65 that are not used for qualified medical expenses increases from 10 to 20 percent.

2012 Provisions

Health Plan Administration

  • Simplified uniform summary of benefits and coverage
  • Reporting health coverage costs on Form W-2: Employers will be required to disclose the value of the health coverage provided by the employer to each employee on the employee’s annual Form W-2. Note that this requirement is effective, but optional, for the 2011 tax year and will be mandatory for later years for most employers. This requirement is optional for small employers (filing fewer than 250 Form W-2s), at least for the 2012 tax year, and will remain optional until further guidance is issued.

2013 Provisions

Health Plan Administration

  • Administrative simplification for the electronic exchange of health information
  • Limiting health FSA contributions: The health care law will limit the amount of contributions to health FSAs to $2,500 per year, indexed by CPI for subsequent years.

Fees and Taxes

  • Eliminating deduction for Medicare Part D subsidy
  • Increased threshold for medical expense deductions: The income threshold for claiming the itemized deduction for medical expenses will increase from 7.5 percent of income to 10 percent.
  • Additional hospital insurance tax for high-wage workers
  • Medical device excise tax
  • 2014 Provisions

    Health Insurance Reform

  • Individual coverage mandates: The health care reform legislation requires most individuals to obtain acceptable health insurance coverage or pay a penalty.
  • Employer coverage requirements: Employers with 50 or more employees that do not offer coverage to their employees will be subject to penalties if any employee receives a government subsidy for health coverage. The penalty amount is up to $2,000 annually for each full-time employee, excluding the first 30 employees. Employers will be required to report to the federal government on health coverage they provide.
  • Health Insurance Exchanges
    The health care reform legislation provides for health insurance exchanges to be established in each state in 2014. Individuals and small employers will be able to shop for insurance through the exchanges. Small employers are those with no more than 100 employees. Large employers with more than 100 employees are to be allowed into the exchanges in 2017.

    Health Insurance Reform
    Additional health insurance reform measures will be implemented beginning in 2014.

    • Guaranteed issue and renewability
    • Pre-existing condition exclusions
    • Insurance premium/underwriting restrictions
    • Nondiscrimination based on health status
    • Nondiscrimination in health care
    • Annual limits: Restricted annual limits will be permitted until 2014. However, in 2014 the plans and issuers may not impose annual limits on the amount of coverage an individual may receive.
    • Excessive waiting periods: Entities offering group coverage will not be able to require a waiting period of more than 90 days.
    • Coverage for clinical trial participants
    • Comprehensive benefits coverage
    • Limits on cost-sharing: Non-grandfathered group health plans will be subject to limits on cost-sharing or out-of-pocket costs.
    • Employer wellness programs: Existing wellness regulations under the Health Insurance Portability and Accountability Act (HIPAA) permit wellness incentives of up to 20 percent of the total premium. Under health care reform, the potential incentive increases to 30 percent of the premium.

    Fees and Taxes

  • Individual health care tax credits
  • Small business tax credit
  • Health insurance provider fee
  • 2018 Provisions

    High-cost plan excise tax: A 40 percent excise tax is to be imposed on the excess benefit of high-cost employer-sponsored health insurance. This is also known as a “Cadillac tax.”

    What Happens Next?

    Regardless of how one feels about health care reform or the politics behind it, it is being implemented. Over the next couple of years, it will achieve momentum that will be difficult to stop. This author’s prediction of what tomorrow may bring includes the following. Health care reform:

    • Takes an increase in taxes, fees, and premiums.
    • Obligates employers to shoulder operational burdens.
    • Makes pre-existing conditions obsolete.
    • Offers immediate and future tax credits to small business.
    • Requires significant expansion of government.
    • Requires most people to have insurance by 2014, which should slow the growth of the uninsured.
    • Overhauls Medicare and Medicaid to make these systems more efficient.
    • Will require extensive clarification from a variety of government entities.

    There are several onerous conflicts built into the legislation. For example, insurance companies will be required to offer insurance to all people regardless of pre-existing conditions. This works when everyone has coverage, yet the individual mandate is riddled with exclusions and lacks strength—as well as facing significant legal challenges in the courts.

    These types of conflicts, and the sheer size and scope of this legislation, makes one wonder if it is all achievable. While the bill was focused on increasing the number of insured lives, the question is whether the cost and administrative burden it creates will exceed its benefits.

    To stay informed, this author suggests one or more of the following:

    1. Follow a health insurance carrier or another reliable source through Twitter, directly on their websites, or through a newsletter subscription. Clarifications and updates to the original legislation are happening frequently.
    2. Understand the basics this article has outlined. Begin to evaluate the role employee benefits, and health insurance specifically, play in the changing dynamics between employer and employees.
    3. Remember to vote and make your voice heard. Whether celebrating health care reform or quaking with anger when it is mentioned, realize there are still ways to improve or modify the legislation.

    Finally, if it’s all just too much, take the path less traveled. Go be healthy. Perhaps if we had all done that in the first place, none of this would have been necessary.

    Notes

    1. http://www.nytimes.com/interactive/2009/07/19/us/politics/20090717_HEALTH_TIMELINE.html.

    2. Kaiser/HRET Survey of Employer-Sponsored Health Benefits 1999-2009.

    3. Towers Perrin 2010 Health Care Cost Survey.

    4. http://www.cdc.gov/diabetes/pubs/factsheet11.htm.

    5. Kaiser/HRET Survey of Employer Sponsored Health Benefits 2009.

    Figure 1

    Construction employment increased in 138 out of 337 metropolitan areas between March 2010 and March 2011, decreased in 153, and stayed level in 46, according to an analysis of federal employment data released by the Associated General Contractors of America (AGC). But association officials said that the industry’s 5-year employment slump is far from over and could worsen as public construction winds down.

    “Even with more metro areas adding jobs than in any 12-month period since November 2007, the fact is most areas are far below previous construction employment peaks,” said Ken Simonson, AGC’s chief economist. “With federal stimulus, base realignment, and Gulf Coast hurricane-protection projects slated to end soon, many areas are at serious risk of another downturn in construction employment.”

    Dallas-Plano-Irving, Texas, again added more construction jobs (9,800 jobs, 10 percent) than any other metro area during the past year, while Bay City, Michigan, added the highest percentage (25 percent, 200 jobs). Other areas adding a large number of jobs included Chicago-Joliet-Naperville, Illinois (3,900 jobs, 4 percent); Warren-Troy-Farmington Hills, Michigan (2,800 jobs, 10 percent); and Northern Virginia (2,600 jobs, 4 percent). Large percentage gains also occurred in Flagstaff, Arizona (24 percent, 400 jobs); Elkhart-Goshen, Indiana (20 percent, 500 jobs); and Houma-Bayou Cane-Thibodaux, Louisiana (18 percent, 900 jobs).

    The largest job losses were in Atlanta-Sandy Spring-Marietta, Georgia (-6,800 jobs, -7 percent) and New York City (-6,800 jobs, -6 percent), closely followed by Los Angeles-Long Beach-Glendale, California (-6,600 jobs, -6 percent). Lewiston, Idaho (-38 percent, -500 jobs) lost the highest percentage. Other areas experiencing large percentage declines in construction employment included Steubenville-Weirton, Ohio-West Virginia (-26 percent, -500 jobs); Bend, Oregon (-16 percent, -500 jobs); and Lafayette, Louisiana (-15 percent, -1,000 jobs).

    AGC officials said that private nonresidential and multifamily construction appear to be stabilizing or picking up in most markets, but that the gains are likely to be offset by pending drops in public construction. Noting that prices for many key construction materials continue to rise, AGC officials cautioned that delaying investments in public construction could likely force taxpayers to pay more for the same work in the future.

    “There is nothing fiscally responsible about buying high instead of buying low when it comes to infrastructure investments,” said Stephen Sandherr, AGC’s chief executive officer. “If public officials would cut red tape and costly regulations like they are cutting construction budgets, that would help boost private sector demand.”

    For more information, please visit www.agc.org.

    Figure 1

    The more we learn about the steam-generating industry, the more we can appreciate its diversity and rich history. Most people have never even been to a power plant, let alone know anything about the history of the power industry. Their knowledge of both extends only to the stacks they see in the distance.

    If you ask someone who is credited with starting or inventing the automobile and the automobile industry, he will likely answer, “Ford.” But how many people know who started the steam-generating industry? Obviously the automobile industry has played an important role in shaping our country, but so has the power industry.

    What Is a Boiler?

    A boiler is a box formed by tubes that uses fire inside that box to heat water into steam. Surrounding those tubes and completely encasing the tube walls and the firebox area are the bril (brick, refractory, insulation, and lagging) materials. The number and size of the tubes, the type of fuel, and the overall physical dimensions of the boiler will all vary depending on what the boiler is designed to produce (water, steam, or heat) and the industry it is intended to serve (e.g., utility, industrial, medical).

    Many components make up or act as a support system for the boiler to meet its designed steam or heat requirements. There are the tubes that carry the water and/or steam throughout the system; soot blowers that keep the unit free of fly ash or dust by blowing steam water or air into the boiler; burners that burn the fuel (oil, gas, coal, refuse); economizers that recover heat from the exit gas and pre-heat the water used for making steam; and many more such systems, including brick, refractory, insulation, and lagging, which help the steam-generating boiler be energy and thermally efficient.

    Who Invented the Boiler?

    The steam-generating boiler’s roots go back to the late 1700s and early 1800s with the development of the kettle-type boiler, which simply boiled water into steam. The water was placed above a fire box and then boiled into steam. It wasn’t until around 1867, with the development of the convection boiler, that the steam-generating industry began.

    It may be debated who developed the first steam-generating boiler; however, most will agree that George Babcock and Steven Wilcox were two of the founding fathers of the steam-generating boiler. They were the first to patent their boiler design, which used tubes inside a firebrick-walled structure to generate steam, in 1867, and they formed Babcock & Wilcox Company in New York City in 1891. Their first boilers were quite small, used lump coal, fired by hand, and operated at a very low rate of heat input. The solid firebrick walls that formed the enclosure for the unit were necessary because they helped the combustion process by reradiating heat back into the furnace area.

    The Stirling Boiler Company, owned by O.C. Barber and named for the street (Stirling Avenue) the facility was on in Barberton, Ohio, also began making boilers in 1891. Their eighth Stirling boiler design was called the H-type boiler (“h” being the eighth letter in the alphabet) and had a brick setting design. The Stirling boiler was much larger than the Babcock & Wilcox boiler and used three drums to help circulate the water and steam flow throughout the boiler.

    In 1907, the Stirling Boiler Company merged with the Babcock & Wilcox Company. They renamed their boiler the H-type Stirling, and it became one of best-selling boilers of its time, probably because of its ability to produce up to 50,000 pounds of steam per hour.

    However, they were not the only boiler manufacturers during the late 1800s. The Grieve Grate Company and the American Stoker Company were also making boilers of similar all-brick-wall design. They both used a traveling or screw-type grate at the bottom of the boiler to transport the fuel (lump coal) across the inside of the boiler. As the fuel traveled across the inside of the boiler, it was burned and the ash or un-burned fuel would drop into a hopper. These two companies later formed the Combustion Engineering
    Company in 1912. The new Combustion Engineering Company offered their version of the Grieve and American Stoker boilers and called it the Type E stoker boiler.

    The Birth of the Power Industry

    With the advent of these new types of boilers and boiler companies, utility companies formed across the country to generate and distribute electricity to the industrial and residential markets. Many cities and towns had their own utility or electric company. Larger cities had numerous utility companies scattered around the city due to the limited amount of steam pressure each boiler and electric generator could produce (on average, approximately 50,000 pounds of steam per hour per boiler). These early utility companies might have as many as 10 to 16 boilers at each facility. Industrial companies that needed a lot of electricity or steam to run their facilities (e.g., Eastman Kodak, which made film and cameras in Rochester, New York, and The Box Board Company—later called the Packaging Corporation of America—which made the boxes for cereal companies in Rittman, Ohio) had their own steam-generating boilers.

    These brick-wall-constructed boilers, sometimes referred to as brick-faced boilers, were the first in the evolution of boiler design, but they were limited in size and capacity. As the size of the boiler increased, so too did the furnace heat input, the boiler rating (pressure), and steam temperature. Thus, continually increasing the size of the boiler furnace raised the temperature the brick was subjected to. These three factors (heat input, pressure, and steam temperature) had a direct effect on the development of boiler furnace designs. The severe furnace conditions began to exceed the temperature limits of the brick walls, and the structural loads became excessive as the boilers kept getting bigger and taller. The young boiler industry needed to eliminate the all-brick-wall design and find an alternative construction that would keep the boiler thermally and energy efficient, generate more steam per hour, and cost less to build.

    This led to the “tube and tile” boiler design around the early 1920s. A tube and tile boiler used large, widely spaced tube walls (6 in. diameter tubes on 9 in. centers) to help cool the surface temperature of the brick. This was a new and radically different design. Unlike the original boiler design, which used 22-in.-thick firebrick walls that required no insulation, the tube and tile boiler used thin tile (2½ in. thick) or firebrick (4½ in. thick) to keep the fire inside the fire box and added insulation over the brick or tile to keep the boiler thermally efficient. With this new development, the boiler industry began to grow just as the boilers began to grow in size and capacity.

    By this time there were many more companies manufacturing these tube and tile boilers: Riley Stoker, Foster Wheeler, Erie City, Zurn, Nebraska, Peabody, Keeler, Union Iron Works, and The Trane Company (to name just a few), with the two largest by sales being the Babcock & Wilcox Company and Combustion Engineering. Each had their own unique loose tube wall constructed boiler designs with multiple boiler types depending on the required capacity. To save in engineering costs, each boiler company developed a line of boilers much like the automobile industry did with the Model-T Ford.

    For example, Babcock & Wilcox developed their version of the tube and tile boiler starting with their type FF, which was a two-drum boiler capable of producing up to 54,000 pounds per hour of steam. For higher capacities they offered the FH, FJ, FL, and the FP, with the largest design and highest steam capacity (100,000 pounds per hour). The same goes for Combustion Engineering Company, which developed their V2M8 and V2M9 (vertical two drum) super-heater boilers.

    The next two most important industry changes occurred in the late 1920s and early 1930s with the introduction of the flat studded tube and the loose tube wall constructed boilers. These two designs allowed the boilers to get the most heat out of burning pulverized coal. The flat studded tube increased heating surface between tubes by adding flat studs all along the tube wall surface. The loose tangent tube design used more tubes close or tangent spaced (touching each other) to increase the heating surface of the tubes. The flat studded tube wall required refractory, insulation, and outer casing to keep the fire inside the fire box, whereas the loose tube tangential wall design used a smear coat of refractory between the tubes and a steel inner casing over the refractory.

    These two designs led to the development of larger, higher-capacity boilers, with the radiant boiler design the largest of all. The radiant boiler used one drum and an increased tube wall and super-heater surface area in the back pass, sometimes referred to as the convection pass (cp) or heat recovery area (hra), to increase steam capacity. For example:

    • Babcock & Wilcox developed the radiant or power boilers: RBC (Radiant Boiler Carolina type, named after the first contract for Carolina Power and Light) for coal fired, RBE (Radiant Boiler El Paso, named after the first contract for El Paso Electric) for oil and gas fired, the SPB (Stirling Power Boiler) for the utility market, and the SS (Small Stirling) boiler for the industrial market.
    • Combustion Engineering developed their radiant and radiant reheat boilers called the VU40 and VU50 (VU for vertical units) for both the utility and industrial markets.

    The steam capacities of these radiant boilers ranged from 400,000 to 1,000,000 pounds of steam per hour. Consequently, the small city- and town-owned power plants became obsolete, as the utility companies could now produce enough electricity for larger residential areas and industrial companies.

    Growth and Specialization

    The biggest change in boiler design came with the development of the membrane tube wall in the late 1950s and early 1960s. Seamless tubes were welded together in a tube shop, using a steel membrane bar between the tubes, and made into a large tube panel. This eliminated the need for refractory for keeping the fire inside the fire box, reduced construction cost, shortened erection schedules, and increased the size of the boilers. The radiant boiler designs could now reach up to 4,000,000 pounds of steam per hour. Later the industry developed the largest of the boiler designs, the universal pressure and supercritical boilers. These steam-generating behemoths could now reach over 1,300 megawatts of electricity or 9,000,000 pounds of steam per hour.

    During the past 100 years, the steam-generating industry has modified or developed boilers specifically suited for and in response to industry needs. For example, around the late 1940s many medical, industrial, college, and government facilities wanted the ability to generate their own steam and electricity. In response to this need, the package or shop-assembled boilers were developed. A package boiler is a pre-engineered steam-generating boiler that ranges in size and steam capacity (typically from 10,000 to 600,000 lb/hr) built in a shop and shipped by rail or barge. Many companies manufactured these small shop-assembled boilers.

    Another example is boilers for the pulp and paper industry, which have been around a very long time and began with the kraft recovery process developed in Danzing, Germany, in 1853. In 1907, the kraft recovery process was introduced in North America. The pulp and paper industry needed a boiler that could generate large quantities of steam and electricity to help run their driers, help them be energy self-sufficient, and, most importantly, help them make smelt. Using the designs described above, the boiler manufacturers developed the “recovery” boiler.

    The recovery boiler’s furnace area is designed to melt the sodium salts in black liquor (the byproduct left over from the pulp-making process). Black liquor droplets fall onto the char bed or furnace floor of the boiler, and the molten inorganic chemicals, or smelt, remains on the furnace floor and flows by gravity through the smelt spout openings into a dissolving tank. The smelt will then be recovered by the paper mill for use in pulp processing. Two such designs were Combustion Engineering’s chemical recovery boiler, called the V2R (vertical 2 drum recovery boiler), and Babcock & Wilcox’s process recovery boiler, called simply a PR boiler.

    New Boiler Designs

    The steam-generating industry also had to develop new boilers in response to non-commercial or industry demands. By the late 1970s and early 1980s, the growing disposal costs for landfills, the passage of the Public Utility Regulatory Policies Act of 1978, and an increased demand for electric power in the United States led to the development of alternative fuel–burning boilers. Many different types of boilers began to be designed to burn alternative fuels such as refuse (trash), wood, and biomass (vine clippings, leaves, grasses, bamboo, and sugar cane or bagasse). A boiler using fluidized bed technology was also designed as an alternative method of burning solid fuels such as coal. Each alternative fuel–burning boiler has the basic components of its predecessors. The boiler manufacturers only modified the fuel input equipment or modified the basic boiler parts to accommodate the transfer of additional air, ash, or the fuel itself.

    Refuse, wood, and biomass boilers are similar to the utility radiant boilers and industrial boilers that burn coal. They fall into the category of “waste-to-energy” boilers. They differ only in the type of refuse, wood, or biomass they burn, and the fuel they burn may vary depending on the time of the year (e.g., autumn may bring more leaves). Due to the many variables of the fuel, the lower furnace environment is constantly changing. There are two basic methods of burning refuse: mass burning, which uses the refuse as received, and prepared refuse or refuse-derived fuel (RDF), for which the refuse is separated and sorted, with the remaining non-recycled material going to the boiler. The burning of either mass refuse or RDF can cause serious corrosion on the tube wall surface. Choosing the right refractory material for the lower furnace walls is critical for efficient boiler operation and tube protection.

    Fluidized bed boilers have most of the basic components of all boilers (steam drum, tubes, economizers, super-heaters, etc.). However, its basic design is different from most other boiler designs. A fluidized bed boiler, depending on the boiler manufacturer, may have cyclones (not to be confused with a cyclone burner), fuel chutes, over-bed burners, collection hoppers, combustion chambers, and stripper coolers. Though the technology of gasification has been around since the 1920s, its use as an alternative fuel–burning method of generating electricity and power began in the late 1970s. The fluidized bed boiler uses a process by which solid fuels are suspended in an upward-flowing gas or air stream at the bottom of the unit. The burning fuel exists in a fluid-like state that has a high heat transfer but with lower reduced emissions. Like the refuse boiler, the lower furnace walls must be protected from the environment created by the burning of the fuel.

    Conclusion

    Unfortunately, power plants are often depicted as dirty, with air pollution spilling into the air. The truth is that power plants are in some of the prettiest areas of the country, along rivers and lakes; spend millions of dollars annually to protect the environment and their neighbors; and keep their facility clean and tidy. If allowed, everyone should visit a local power plant and see how beautiful the country around the plant is and how clean the plant is—and at the same time take note of what type of boiler it has.

    References

    The information contained in this article was obtained primarily from public sources, without direct input from any of the boiler manufacturers.

    Combustion Fossil Power, Combustion Engineering, Inc., 4th Edition (1991).

    Steam, its generation and use, Babcock & Wilcox Company,
    40th Edition (1992).

    Babcock & Wilcox a corporate history, Carlisle Printing Company,
    N.W. Eft (1999)

    Refractories in the Generation of Steam Power, McGraw-Hill Book
    Company, F. H. Norton (1949).

    The primary purpose of a steam-generating boiler is to make steam to generate electricity. Super-heated steam comes from a boiler to a turbine and turns the turbine blades to create electricity. How water enters and leaves a boiler is called the boiler and steam circulatory system. The pipes and tubes that make up these circulatory systems have many parts.

    For a boiler to make steam continuously, it must have water circulating through its tubes. Boilers use thermal circulation, in which water is exposed to heat and begins to turn into a water/steam mixture. Since a combination of water and steam is less dense than water, gravity will cause the water to move down and the steam/water mixture to rise.

    All steam-generating boilers have the same systems described below. For this article, a radiant power pulverized coal–fired boiler is our example.

    A radiant power pulverized coal–fired boiler is divided into three areas:

    1. furnace area, where the heat source is located
    2. super-heater area, where super-heated steam is made
    3. convection pass or heat recovery area, where the economizer is located.

    Within these areas, the combination of water/steam circulates throughout the boiler. Figure 1 shows a typical radiant boiler circulatory system.

    Water/Steam Circulatory System

    Before water can enter a steam-generating boiler, it must first be treated and cleaned of minerals and alkalis (e.g., iron or calcium) that could clog the tubes and prevent proper circulation. After the water has been treated or cleaned, it is pre-heated in feedwater heater tanks. The pre-heated water then enters the boiler at the economizer inlet header. The piping system carrying the water to the economizer inlet header is called the feedwater piping system. (Note: The temperatures shown in Figure 1 for each system are taken from historical data and will vary depending on boiler design and operation.)

    For a radiant boiler, the temperature for the feedwater heater to the economizer inlet is approximately 483ºF (for an industrial boiler or fluidized bed-type boiler, the temperature would be approximately 100ºF less). The water circulates up through the economizer tubes to the economizer outlet header, where it reaches 576ºF. From the economizer outlet header, the water/steam goes through 8 in. IPS economizer connecting pipes to the steam drum.

    The steam drum is 6.5 ft in diameter and collects and distributes the water/steam as it continuously circulates throughout the boiler. Once the water/steam enters the drum from the economizer outlet header via the economizer connecting pipe, it is forced by gravity down pipes called downcomers.

    Downcomers are large diameter pipes (25 in. IPS) that take the water/steam coming from the steam drum down to the lower water wall headers of the convection pass and furnace walls.

    Supply tubes (5 in. diameter) supply the steam/water from the downcomers to the individual lower water wall headers. The water/steam then rises through the wall tubes (natural thermal circulation) until it reaches the upper water wall headers. The temperature of the water/steam has by this time reached 688ºF. Riser tubes, so named for the water/steam rising from the upper water headers, take the 688ºF water/steam back to the steam drum.

    The water/steam circulatory system ends inside the steam drum. However, there is still one more step before the steam enters the next circulatory system. The water/steam mixture entering the drum still contains moisture (water) and so must enter the steam/water separation area in the upper half of the steam drum. The steam/water separation area consists of many cylindrical tubes called cyclone separators. Cyclone separators spin the wet water/steam mix in a cyclonic action, separating the water out of the wet mixture by centrifugal force. The wet moisture falls down into the lower half of the steam drum, where it is mixed with the water/steam coming from economizer outlet header, goes into the downcomers, and begins the circulatory process all over again.

    The super-heated steam circulatory system begins with the now dry 688ºF steam. The dry steam rises out of the steam drum from the cyclone separators via steam outlet connection piping at the top of the steam drum. The steam outlet connection piping takes the dry steam to the super-heated steam circulatory system of the boiler.

    Super-Heated Steam Circulatory System

    The super-heated steam circulatory system is where the dry steam from the boiler is super-heated and sent to the electric generator or turbine. Tubes, bundled into sections with multiple loops, are suspended inside the boiler, where hot flue gases from the furnace pass around these tube banks. The number of super-heater tube banks is based on the boiler size and steam outlet temperature requirements.

    The super-heated steam circulatory system begins with the 688ºF dry steam coming from the steam drum via the steam outlet connection piping to the primary super-heater inlet header. The steam circulates through the primary super-heater inlet and outlet tube banks, circulating up and down until it reaches the primary super-heater outlet header. The temperature of the steam has now reached 811ºF. A connecting pipe transfers the 811ºF steam to the secondary super-heater inlet header. Between the primary outlet header and secondary inlet header are spray water attemperators. Attemperators are headers with sensors that can monitor and control the temperature of the steam leaving the primary super-heater outlet header. They are so named because they spray water or wet steam as a means of temperature control.

    The 811ºF temperature steam circulates through the secondary super-heater tube sections, going up and down until it reaches the secondary super-heater outlet header. The temperature of the dry super-heated steam is now 1,005ºF.

    The tube banks of the primary and secondary super-heater sections are above the furnace arch tubes. The water wall tubes directly under the tube banks are sometimes referred to as the super-heater floor tubes. In Figure 1, notice that the placement of the primary and secondary super-heater tube sections is in the middle of the unit, directly between the convection pass (heat recovery area) and the furnace area of the boiler. Also note that the secondary super-heater tube sections are in front of the primary super-heater tube sections, capturing more of the maximum amount of furnace heat.

    Associated Piping

    All exposed piping on the exterior of the boiler requires insulation and finish material (e.g., aluminum jacketing). Understanding the source temperature of the piping system requiring insulating is paramount. The temperature of the drain lines from the economizer inlet is different from that of the drain lines of the lower water wall headers. Soot blower piping can come from either the primary outlet header or the secondary outlet header.

    The insulation thickness should be based on where the piping is coming from. There is a lot of individually insulated piping of various sizes. Refer to the typical radiant boiler piping take-off in Figure 2, which shows more than 3,500 lineal feet of individually insulated piping and more than 2,800 square feet of mineral wool blanket for piping that can be bundled.

    Conclusion

    Understanding the water and steam circulatory system of a boiler is the first step in proper boiler design. A boiler’s primary function is to make steam to generate electricity. Only by knowing the boiler circulatory systems, their temperatures, and boiler function will designers and installers be able to properly insulate the piping systems and maximize energy efficiency. The better our understanding of the steam circulatory system of a boiler, the better and more cost-effective the insulation systems will be.

    References

    The information contained in this article has been obtained primarily from public sources, without direct input from any of the boiler manufacturers.

    Combustion Fossil Power, Combustion Engineering, Inc.,
    4th Edition (1991).

    Steam, its generation and use, Babcock & Wilcox Company,
    40th Edition (1992).

    Figure 1

    Typical radiant boiler circulatory system

    Figure 2

    Typical radiant boiler piping take-off

    Figure 3

    Electric generator

    Figure 4

    Feedwater heating and pumping

    In 2010, a mechanical insulation energy appraisal was conducted on a variety of State of Montana facilities in and around Helena. The objective of the Montana Mechanical Insulation Assessment Pilot Program was to determine the energy, cost, and emission reduction opportunities available via the repair, replacement, and/or maintenance of mechanical insulation systems in Montana’s state facilities. The assessment addressed mechanical rooms in 25 facilities pre-selected by State of Montana personnel based on the potential for energy savings.

    The Pilot Program was part of the data gathering objective of the Mechanical Insulation Education and Awareness Campaign (MIC). In May 2009, the National Insulation Association (NIA) and the International Association of Heat and Frost Insulators and Allied Workers (International) created an alliance to educate industry on and promote the benefits of mechanical insulation. The MIC, one of the major initiatives of the alliance, is being executed under the U.S. Department of Energy’s Industrial Technologies Program. Project Performance Corporation (PPC) and NIA, in conjunction with its alliance with the International, are working together to design, implement, and execute the MIC.

    The MIC’s goal is to increase awareness of the energy efficiency, emission reduction, economic stimulus, and other benefits of mechanical insulation in the industrial and commercial markets. The potential of mechanical insulation to play a significant role in reducing energy intensity is immense; however, the lack of sufficient data to support its energy efficiency potential, combined with a deficient understanding of what mechanical insulation is and how it can be utilized, impedes policy makers and actors in industrial and commercial sectors in making a supportable case for increased use and maintenance of mechanical insulation.

    Approach

    The overall approach for this Pilot Program was to assemble a team of insulation professionals to conduct a mechanical insulation appraisal of State of Montana facilities in the Helena area. The assessment team, with assistance from State of Montana personnel, performed the following tasks:

    1. Identified opportunities to improve insulation in the mechanical rooms visited
    2. Estimated costs to improve or upgrade the insulation systems
    3. Estimated the savings (in dekatherms, dollars, and CO2 emissions) associated with the insulation upgrades, and calculated the resulting payback period and return on investment.

    The list of candidate buildings in the Helena area was developed and prioritized by State of Montana personnel based on the potential for energy savings from mechanical insulation. Buildings with steam and/or hydronic heating systems were therefore included, while buildings with forced air furnaces were excluded. The 25 facilities visited included a variety of building types (office buildings, assembly facilities, dormitories, maintenance facilities, and museums) and represented roughly 1.3 million square feet.

    The scope of this study was limited to the assessment of the mechanical insulation on piping and equipment in the mechanical rooms of the selected facilities. Opportunities for repair and replacement of insulation on piping and ductwork within the building proper were not considered. This effort should not be considered an energy audit of the buildings visited. Energy conservation opportunities related to building envelope insulation or sealing, lighting, controls, ventilation, and equipment maintenance were also considered outside the scope of this study.

    For each mechanical room, an insulation summary that identified items where insulation was missing or had sustained significant damage was developed. The team also identified the thicknesses that would bring the insulation level up to the level of the existing insulation. No attempt was made to “optimize” the level of insulation or to identify whether the existing insulation levels would meet or exceed levels required by local building codes or other requirements. Also, no assessment was made of the efficiency of existing insulation. Additional savings may be possible by upgrading the existing insulation level, but these savings would be small compared to insulating the uninsulated or damaged items identified in the appraisal.

    During the field visits, additional information was collected about the energy systems in each mechanical room to enable the estimation of energy savings, including: the location of the mechanical room within the building, operating temperatures, estimated hours of operation, estimated efficiency of the equipment, and general control strategies. Budget-type cost estimates were also developed based on the summary information on a by-facility basis.

    Assessment Results

    Each of the facilities chosen for analysis had at least a few items that needed insulation. The smallest number of individual items identified in a building was 14 (1 12-ft length of 2-in. copper tube; 1 3-ft length of ¾-in. copper tube; 6 2-in. 90s; 5 2-in. ball valves; and 1 ¾-in. ball valve). The largest concentration of items was in the Boiler Plant that provides central steam and domestic hot water to four buildings in the Capitol Complex. Approximately 400 individual items were identified in this facility (including the tunnels), and savings due to insulation provided an estimated payback of 4.0 years.

    Overall, approximately 3,500 items were identified. Estimated total savings were approximately 6 billion Btus per year, with an estimated payback of 4.1 years and an annualized rate of return of 24 percent. These projected savings are primarily savings in natural gas usage and represent roughly 8 percent of the total natural gas consumption of the facilities analyzed.

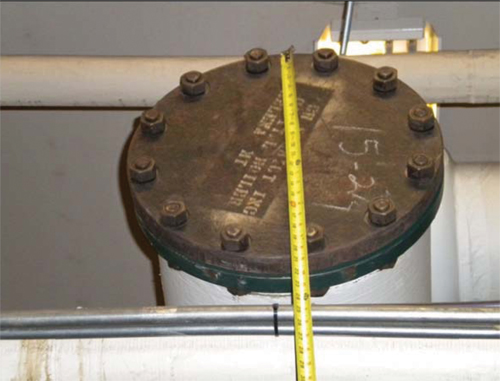
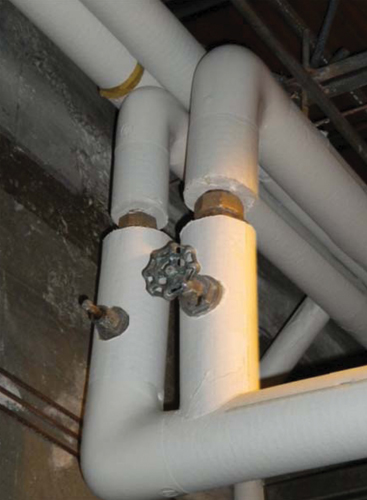
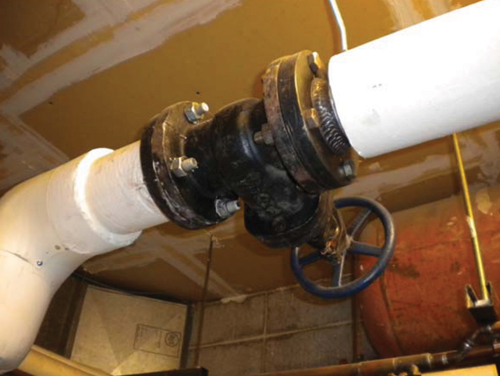
    As expected, some of the items identified were large (for example, the uninsulated flanged end cap on a large, low-pressure steam header shown in Figure 1). The majority, however, were relatively small (like the uninsulated unions and valve bonnets on the hot water heating lines shown in Figure 2). While the savings from any single item is small, the aggregated total savings from thousands of small items is significant.

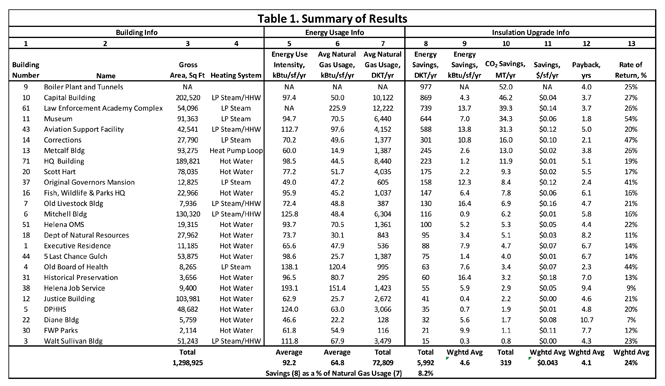
    Figure 2 summarizes the overall results of the appraisal, sorted in order of decreasing energy savings. Building energy usage information (columns 5-7) was derived from data provided by State of Montana personnel and, in most cases, is the average usage over a 4-year period (FY 2007–FY 2010).1

    Energy Use Intensity2 (EUI, column 5) is the annual building site energy consumption (electrical and natural gas) per square foot of gross building area. Units are kBtu/sf/yr. Available EUIs3 for the Helena buildings range from a high of 193 to a low of 47. The unweighted average EUI for the Helena buildings is roughly 92 kBtu/sf/yr. For reference, the U.S. Energy Information Agency’s Commercial Building Energy Consumption Survey4 for this climate zone lists average EUI values for offices at 92 and assembly buildings at 102.

    Average natural gas usage is given on an absolute basis in column 7. Note that no natural gas usage is shown for Building 9, the Boiler Plant. Natural gas-fired boilers in the Boiler Plant generate low pressure (5 psig) steam for distribution to four other buildings. Natural gas usage in the Boiler Plant has been allocated to those buildings.

    Estimated energy savings due to identified insulation opportunities are given in column 8. Column 9 gives those energy savings normalized to building area. A number of key assumptions were required to develop the energy savings estimates, including the operating hours of the mechanical systems involved (heating systems are assumed to operate for 8 months during the winter or 5,840 hours per year). Additional assumptions include the operating temperatures and the ambient conditions inside the mechanical rooms (assumed to be 80°F with 1 mph wind speed).

    The total estimated savings are approximately 6 billion Btu/yr. The weighted average savings are 4.6 kBtu/sf/yr. This represents 8.2 percent of the natural gas usage in the facilities studied. Note that in most cases, the insulation opportunities identified will reduce natural gas consumption. However, a few of the buildings have electrically heated domestic hot water systems, so in those buildings, a small portion of the energy savings due to mechanical insulation will show up as electrical energy savings. These electrical energy savings have been expressed as dekatherms and included in the estimates in columns 8 and 9.

    The savings estimates in column 8 are converted to the associated reductions in CO2 emissions in column 10 (metric tonnes per year) and to financial savings ($/sf/yr) in column 11.

    Insulation cost estimates were prepared on a by-facility basis using the summaries developed during the site visits. The estimates assume a variety of insulation systems depending on the application. The primary insulation system used in the estimates was fiberglass pipe insulation with all service jacket and removable/replaceable flexible insulation covers.

    Column 12 shows the estimated payback period of the insulation project in years, while column 13 gives the annualized rate of return (assuming a 20-year life and no fuel cost escalation5). The estimated payback periods range from 1.8 years to 10.7 years. Corresponding annualized returns range from around 54 to 7 percent.

    As might be expected, the steam-heated facilities generally show shorter payback periods. Steam supply piping operates at roughly 230°F during the heating season, while hot water supply temperatures are normally reset in a range from 120°F to 180°F based on outdoor temperatures. Insulating steam systems will therefore exhibit not only greater energy savings but also faster payback periods.

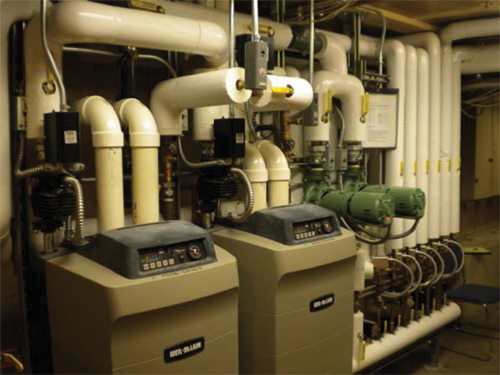
    The variation in financial returns is not unexpected. All the buildings inspected had mechanical insulation on their steam and hot water lines, although some systems were in better shape than others. Several had been recently upgraded to high-efficiency condensing boilers with well-insulated piping (Figure 4). While several small items were identified in each of these facilities, the “low-hanging fruit” had been gathered.

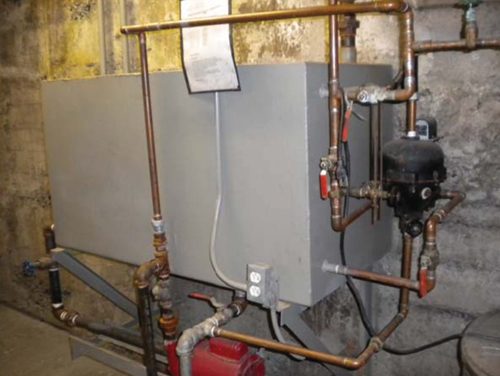
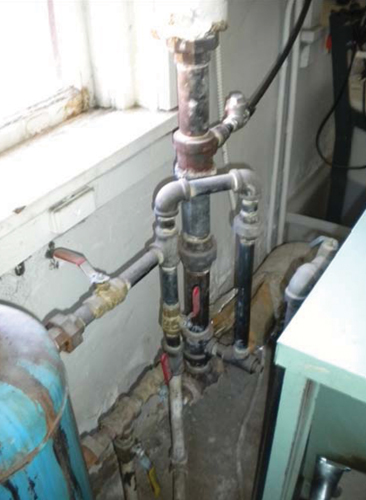
    On the other end of the spectrum, several buildings have insulation opportunities that will yield more immediate returns (see Figures 5 through 7).

    Results

    The results of this study demonstrate that there are numerous opportunities for improving the mechanical insulation application in steam and hydronic heated buildings in Montana. One question prompted by the appraisal is, “Why are there so many pieces of missing insulation?” In many locations, it was obvious that some maintenance task had required removal of the insulation, which was simply not replaced after the maintenance was completed. This was observed in several locations where a domestic hot water (DHW) storage tank had been removed and replaced with a newer tank, and piping connections to the tank were left uninsulated. It is likely that the personnel performing this work did not have either the materials or the proper training to complete the job.

    In some areas, either mechanical damage or leaks had occurred and the damaged insulation had not been replaced. More common, however, were items that had never been insulated. For buildings and systems designed and built when energy was cheap, the “extent of insulation” was not nearly as complete as it is today. Items like pipe unions, strainers, steam traps, condensate tanks, expansion joints, valves, flanged joints, pumps, and tanks were routinely left uninsulated.

    The DHW systems in the buildings visited illustrated the interactions often present in energy conservation projects. A number of the buildings contained newer high-efficiency DHW storage tanks. Some buildings, however, used older conventional-style gas-fired water heaters. For the older DHW tanks, we analyzed the addition of a 1½-in.-thick tank blanket to minimize heat loss. These DHW tanks typically operate year round (8,760 hours per year). For a typical 24 in. diameter by 60 in. tall tank, energy savings can be on the order of $30 per year. These savings were included in the analysis where applicable. Depending on the age of the DHW tank, it may be more reasonable to consider replacing these tanks with high-efficiency units. This alternative (and mutually exclusive) option was not investigated in this study.

    A related interaction issue concerns the DHW circulating systems. Most of the buildings in the study use circulating pumps in the DHW loops. These pumps minimize city water consumption since occupants have hot water at fixtures on demand (rather than having to wait for hot water). Some of the facilities have been fitted with timers to limit the hours of operation of the circulating pumps (and the associated heat loss from DHW piping) to occupied hours. In other buildings, the circulating pumps run continuously. For these buildings, the insulation replacement items look very attractive (since savings are directly proportional to operating hours). The alternative option of installing a timer to limit hours of operation would reduce the savings from insulation. The two options, however, are not mutually exclusive, and installation of timers should be considered in addition to replacing any missing insulation in the DHW loop.

    Extrapolating the Results Statewide

    One of the Pilot Program’s objectives was to use the results to estimate the savings possible if the program were expanded to cover all the similar state-owned buildings in Montana. The State of Montana has a statewide inventory of approximately 2,000 buildings of all types, such as roadside rest facilities, historical village gift shops, prisons, and university football stadiums. Many of these facilities are small, seasonal, and with specialized usage and/or limited occupancy. The results of this study will obviously not apply to many of these facilities, so extrapolation to all state buildings in Montana is not meaningful. Projections to similar state-owned facilities are possible and may be useful.

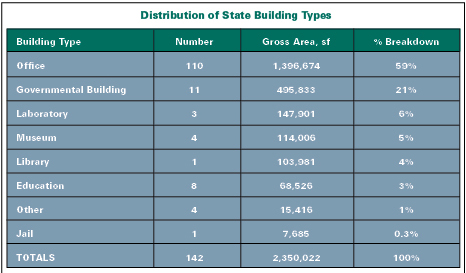
    The initial step toward that objective was to review a list of state buildings provided by State of Montana personnel. The facilities on the list were considered potential candidates for inclusion in mechanical insulation upgrade projects. The information provided included building designation and location, year built, occupancy code, gross area (in square feet), number of stories, and number of full-time employees. The list contained a total of 142 buildings with a total gross area of 2.35 million square feet. The distribution of those 142 buildings by type is shown in Figure 8.

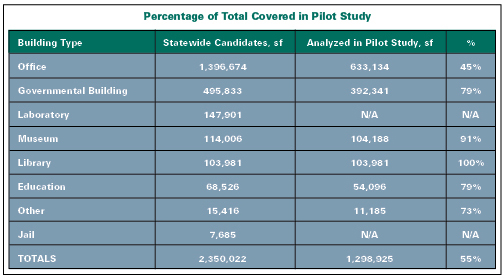
    The pilot study of Helena buildings covered several of the larger state buildings on the list, representing a significant percentage of the total. Overall, approximately 55 percent of the square footage identified on the candidate list was included in the study. Figure 9 breaks this percentage down based on building type. As a first-order estimate, the energy savings from the Helena study can be prorated based on building area. Annual energy savings from the 25 facilities analyzed in Helena averaged about 4.6 kBtu/sf/yr, about $0.043/sf/yr. If these savings were prorated to the statewide candidate list (2.35 million square feet), they would total 10,800 DKT/yr, or $101,000/yr.

    Additional analysis could refine this estimate. We know, for example, that steam-heated and hydronic heating systems will have more opportunities for mechanical insulation than forced-air heating systems. In addition, we know that some of the candidate buildings have already been addressed. More information about the building inventory statewide would allow a more precise estimate, but an order-of-magnitude savings of 10 billion Btus (8 percent savings per year) statewide is not unreasonable. We would expect installation costs to be similar, so annualized returns of 24 percent could be achieved.

    Little Things Matter

    Approximately 3,500 items were identified in 25 buildings (56 mechanical rooms) in the Pilot Program, with estimated energy savings of approximately 6 billion Btu per year, a resulting overall payback period of 4.1 years, and an annualized rate of return of 24 percent. Associated reductions in CO2 emissions are estimated at 300 metric tonnes per year. On a square foot of gross building area basis, the energy savings averaged 4.6 kBtu/sf/yr, while energy cost savings averaged $0.043/sf. Similar results, 8 percent savings of natural gas consumption, could reasonably be expected in similar Montana facilities.

    While the savings from any single item is small, the aggregated total savings from thousands of small items is significant. The appraisal results confirm the value of addressing missing, damaged, or uninsulated areas. The payback period and internal rate of return are based on actual operating conditions, 80°F ambient temperature, service temperature, and hours of operation (in many cases, less than 6 months per year).

    The results tell an impressive story for the maintenance of mechanical insulation in commercial building applications. The findings confirm the energy savings, emission reduction, and financial benefits of looking at mechanical insulation differently. What is the energy-saving potential in your facility?

    Notes

    1. Annual Heating Degree Days over this 4-year period averaged 7,751, or about 0.9 percent higher than the long-term average for Helena.

    2. For site EUI calculations, 1 kWh of electrical energy is 3,412 Btu and 1 dekatherm is 1,000,000 Btu.

    3. Electrical consumption at the Montana Law Enforcement Academy Complex is billed from a master meter, so EUI could not be broken out for the portion of that campus analyzed.

    4. U.S. EIA, 2003 Commercial Building Energy Consumption Survey (average for climate zones with HDD>7,000).

    5. Energy costs are volatile and notoriously difficult to predict. While long-term energy costs are expected to increase, recent natural gas costs have been falling. A fuel cost escalation rate of 0 percent seems reasonable for this analysis. If a 3 percent annual fuel cost escalation rate was assumed, annualized returns would increase by about 3 percent. For example, the 27 percent return estimated for the Capitol Building would increase to 30 percent if a 3 percent/yr fuel cost escalation rate was used.

    Figure 1

    Uninsulated end cap on steam header

    Figure 2

    Uninsulated unions and valve bonnets in heating hot water lines

    Figure 3

    Summary of results

    Figure 4

    Diane Building (22) boiler installation

    Figure 5

    Uninsulated condensate tank in Corrections Building (14)

    Figure 6

    Condensate piping in Original Governor’s Mansion (38)

    Figure 7

    Uninsulated steam valve in Fish Wildlife and Parks Building (16)

    Figure 8

    Distribution of State Building Types

    Figure 9

    Percentage of Total Covered in Pilot Study

    The Environmental Protection Agency (EPA) recently issued four rules that create emissions standards and other work practice requirements for facilities with boilers based on criteria such as size, design, and fuels used. Among other things, the rules divide the world of combustion units into those fueled by “legitimate fuels” and those incinerating solid waste and update the definition of “solid waste.”

    The rules, below, were published in the Federal Register on March 21, 2011:

    • National Emission Standards for Hazardous Air Pollutants for Major Sources: Industrial, Commercial, and Institutional Boilers and Process Heaters (Major Source ICI Boiler NESHAP)
    • National Emission Standards for Hazardous Air Pollutants for Area Sources: Industrial, Commercial, and Institutional Boilers (Area Source ICI Boiler NESHAP)
    • Standards of Performance for New Stationary Sources and Emission Guidelines for Existing Sources: Commercial and Industrial Solid Waste Incineration Units (CISWI)
    • Identification of Non-Hazardous Secondary Materials That Are Solid Waste (New solid waste definition).

    Combustion units incinerating solid waste will be regulated by the relatively stringent CISWI standards. Major combustion units fueled by non-waste traditional fuels will be regulated by the new Major Source ICI Boiler NESHAP or the more relaxed Area Source ICI Boiler NESHAP for smaller units.

    Existing affected sources must comply with the applicable rule no later than 3 years after its Federal Register publication date. New and reconstructed affected sources (i.e., those commencing construction after June 4, 2010, the date on which EPA first proposed these regulations) must comply with the applicable rule within 60 days of publication or immediately upon startup, whichever is later.

    For a more detailed explanation of the rules, please visit www.ballardspahr.com.

    Copyright 2011 by, and reprinted with the permission of, the law firm Ballard Spahr LLP. This alert aims to notify recipients about legal developments. The content is intended for general information purposes only. It should not be construed as legal advice or legal opinion on any specific facts or circumstances. You are advised to consult your Ballard Spahr or other attorney regarding your specific legal situation. This alert is available online at www.ballardspahr.com.

    All steam-generating units or facilities are divided into two parts: the “boiler island” for steam generation and the “back end” or air quality control system (AQCS) area, where spent gases are cleaned and discharged into the atmosphere. Specially designed equipment is placed strategically around the boiler to use the hot gases carried by flues and the air carried by ducts to help the boiler be energy efficient.

    On a fluidized bed boiler (circulating or bubbling bed*), for example, the flue gases leave the boiler and pass through a mechanical dust collector, economizer, and air heater on their way toward the back end and the stack. Figure 1 shows a typical flue and duct arrangement for a fluidized bed boiler.

    Mechanical Dust Collector

    Mechanical dust collectors are most commonly found on industrial-type steam-generating boilers (e.g., stoker-fired or hopper-bottom pulverized coal–fired). The mechanical dust collectors are perfectly suited for these types of boilers, which predominantly produce large dust and ash particles. The dust collectors collect these particles and re-inject them back into the furnace, helping improve boiler efficiency. A dust collector does not remove the finer/smaller dust particulates, which must be removed by precipitators or baghouses on the back end past the air heater to meet today’s emission requirements.

    With the development of fluidized bed boilers, the mechanical dust collector again became an essential piece of equipment for boiler efficiency. Mechanical dust collectors, sometimes called cyclones, are located at the boiler gas outlet. A mechanical dust collector removes the larger size dust and ash particles from the flue gases leaving the fluidized bed boiler and feeds them back to the bed or fuel burning area.

    How a mechanical dust collector works is quite simple (see view B-B on Figure 1). Dirty flue gases enter the top of the dust collector and “cyclone” around inside individual cylindrical tubes. Inside these cylindrical tubes, the cyclonic action of the flue gas and the centrifugal forces drive the larger dust particles out of the flue gas. These dust particles then fall down into a collecting hopper, where they will be collected and recirculated back into the boiler as bed material. The process of recirculating unburned particulates back into the boiler makes the dust collector an energy-saving and essential piece of equipment for a fluidized bed boiler.

    Economizer

    An economizer is a form of heat exchanger made of insulated tubes used to preheat the boiler feed water before it enters a steam drum or furnace wall circuitry. The economizer tubes are within either a tube wall enclosure or steel-cased walls. The most common economizer design is the bare tube in-line type, as shown in Figure 1. The tubes are horizontally placed in-line, or right on top of each other, to allow the flue gas to flow freely down around the tubes.

    The use of economizers with steam-generating boilers goes back to the earliest boiler designs. The early boiler designers found that by adding tube banks near or at their boiler gas outlets, they could economically heat their water, save money, and reduce operating costs. Water enters at the bottom of the economizer tube bank and circulates up through the rows of tubes. Hot flue gases pass around the tubes, lowering the exit flue gas temperature and increasing the water temperature inside the economizer tubes.

    Small, shop-assembled economizers were used on the early industrial boilers (e.g., stoker- or pulverized coal–fired boilers). The economizer tubes were housed inside a cased wall open at the top and bottom. These shop-assembled economizers were also insulated and either outer lagged or outer cased in the shop prior to being shipped to the plant.

    As boilers increased in size and capacity, so too did the boilers’ exit gas temperature. The higher gas temperatures and larger widths across the boiler gas outlets made shop-assembled economizers unfeasible. Economizer tube banks then had to be field installed. For the fluidized bed boiler, the economizer is located after the dust collector and is normally insulated and lagged in the field. The thickness of the insulation required on the economizer casing is based on the temperature of the flue gas leaving the boiler gas outlet.

    Air Heater

    Air heaters are also a form of heat exchanger. They are used to heat cold air that will be used for combustion/burning of fuel using flue gases. This is by far the most common method of increasing boiler efficiency and energy savings. The two basic types of air heaters are the recuperative and the regenerative.

    A recuperative air heater has no moving parts; heat is taken from the hot flue gas and transferred or exchanged to make cold air hot. The most common type of recuperative air heater is the “tubular” air heater, which has small-diameter tubes housed inside a casing box. The tubes are connected to a perforated plate at the top and bottom. Gas will flow through the tubes while air flows around the tubes. The size of the tubular air heater depends on the boiler operating conditions. The number of passes the air or gas makes is determined by the temperature of the air required at the burners and space/structural limitations. For example, there are multiple-gas-pass tubular air heaters with a single air pass and there are single-gas-pass tubular air heaters with multiple air passes. The insulation thicknesses for each air pass, regardless of type, is based on the temperature of the air leaving that air pass.

    To calculate the air temperature on a three-air-pass tubular air heater as shown in Figure 1, a designer or engineer would need to know the air temperature entering and leaving the air heater and use the following formula:

    Air Pass Number (1st pass, 2nd pass, or 3rd pass) x (total increase of air temperature) + (temperature of air entering air heater) (total number of air passes)

    OR

    1st pass x (420degF-150degF) + (150degF) =
    240degF (3 air passes)

    This type of air heater is most commonly used on industrial-type (e.g., refuse, wood, and biomass boilers) and fluidized bed-type boilers.

    A regenerative air heater has moving parts, and the exchange of heat is done by exposing a metal heating surface to the hot flue gases and transferring/exchanging the heat to the cold air passing over the metal heating surface. The exchange of heat is done twice. First, hot flue gases exchange their heat to a metal surface, and then the metal surface exchanges its heat to the cold air entering the air heater. This type of air heater is most commonly used on utility boilers, where the gas and air temperatures are higher.

    The two types of regenerative air heaters most commonly used in the power industry are the Ljungstrom and Rothemuhle. The Ljungstrom has a rotating heating surface, with the flue gases passing down through one side of the air heater as the cold air passes up through the other side. The Rothemuhle uses a fixed heating surface with a rotating housing. Flue gases come down into a hood and pass over the heating surface. Cold air enters the bottom of the heating surface housing and exits through an air duct in the hood housing. A regenerative air heater’s insulation thickness is based on the temperature of the flue gas entering the air heater.

    Conclusion

    The primary purpose of the boiler island equipment is to help the boiler make its steam or heat requirements. Without dust collectors, economizers, and air heaters, the boiler, especially a fluidized bed type, could not function properly. Any equipment or component, such as insulation, that saves energy also saves money at a rate important to any steam-generating unit.

    *Circulating and bubbling fluidized bed boilers (CFB and BFB) are two types of fluidized bed boilers. A fluidized bed boiler uses a process by which solid fuels (i.e., coal) are suspended in an upward flowing gas or air stream at the bottom of the unit in which the burning fuel exists in a fluid-like state. The fuel is fed into the lower portion of the furnace area called the furnace bed. The bed area mixes the fuel with gas or air, and the mixture combusts.

    References

    The information contained in this article has been obtained primarily from public sources, without direct input from any of the boiler manufacturers.

    Combustion Fossil Power, Combustion Engineering, Inc.,
    4th Edition (1991).

    Steam, its generation and use, Babcock & Wilcox Company,
    40th Edition (1992).

    Figure 1