Category Archives: Global

Discussion about renewable energy sources and usage is increasing around the world, especially among industries in the United

States. While coal, oil and natural gas prices soar, and greenhouse gas emissions continue to affect the earth’s climate,

alternatives for power are more attractive than ever.

There are five main renewable energy sources currently proven to provide “clean,” usable energy: biomass, geothermal,

hydrogen, hydropower, ocean, solar and wind. Biomass and hydropower sources top the list, both with relatively high

percentages of current usage—close to 45 percent.

Despite their proven effectiveness and our increasing need for them, the Department of Energy (DOE) Energy Information

Administration (EIA) reports that renewable energy sources are a modest part of our energy portfolio, accounting for only 6

percent of the country’s total energy supply. Although there has been booming growth of solar and wind power usage—both

by about 30 percent—renewable energy consumption reportedly has not budged since 1989, and the EIA expects just a 2

percent increase in usage by 2025.

This flat growth is due not only to the current dependence on fossil fuel power but also to the fact that many renewable

energy resource processes need to be improved and made cheaper to maintain. As fossil fuels continue to have negative impacts

on our society, though, the U.S. government, through many environmental agencies, is putting the pressure on industries to

find “greener” plant processes. Renewable energy is one good consideration, but pros and cons must be evaluated.

For instance, the DOE is providing $44 million this year in State Energy Program (SEP) grants to support and encourage

energy-saving and efficiency goals in every state and U.S. territory, Puerto Rico and the U.S. Virgin Islands

(www.eere.energy.gov/states/).
The SEP saves an average of 41.35 million Btus per year, reducing energy bills by $256 million.


Renewable Energy Defined

The DOE’s Energy Efficiency and Renewable Energy (EERE) office reports that hydropower is currently the largest source of

renewable power, generating nearly 10 percent of the electricity used in the United States.

Hydropower comes from capturing energy created by flowing water—most notably through a dammed river or lake—and

turning it into electricity. The dammed method of hydropower is called impoundment. Diversion methods channel part of the

flow of a river through a canal or penstock and may not require the use of a dam. There are various sizes of hydropower

plants, depending on the amount of electricity needed.

Newer methods of hydropower, called pumped storage, allow water in a lower pool to be pumped to an upper pool during off-peak

hours for storage until peak hours, when the upper water is released through a hydroelectric turbine to create valuable

peaking electricity during times of high demand. However, because pumped storage still requires the use of coal or nuclear

electricity to operate the turbine, it falls in the category of improved economics rather than renewable energy source.

Biomass is any plant-derived organic matter available on a renewable basis, such as agricultural food and feed crops and

animal wastes. According to EERE, technologies use renewable biomass resources to produce an array of energy-related products

including electricity, liquid, solid and gaseous fuels, heat, chemicals and other materials. Biopower technologies are proven

electricity-generation options in the United States, and there are a variety of fuels created from biomass resources: liquid

fuels like ethanol and methanol, and gaseous fuels like hydrogen and methane. Products made from biobased chemicals include

renewable plastics and natural fibers.

Bioenergy ranks a very close second to hydropower in renewable U.S. primary energy production, accounting for 3 percent of

the primary energy production in the country. The EIA reports that bioenergy used to rank number one but has declined

gradually over the past several years.

Hydrogen is the simplest and most plentiful element in the universe; however, it does not occur naturally as a gas on the

Earth. Instead, it is combined with other elements, as in water, which is a combination of hydrogen and oxygen (H2O).

Hydrogen is also found in many organic compounds like the “hydrocarbons” that make up many of our fuels: gasoline, natural

gas, methanol and propane. Hydrogen is produced from these sources through the application of heat: from bacteria or algae

through photosynthesis, or by using electricity or sunlight to split water into hydrogen and oxygen.

EERE states that even though hydrogen is high in energy, an engine that burns pure hydrogen produces almost no pollution. The

space shuttle is a perfect example. NASA has used liquid hydrogen since the 1970s to propel the shuttle and other rockets

into orbit. In addition to the rocket engines, hydrogen fuel cells power the shuttle’s electrical systems, producing a clean

byproduct—pure water, which the crew drinks. A fuel cell is like a battery that is constantly replenished by adding

fuel to it. It never loses its charge.

Hydrogen potentially could be used to power vehicles or run turbines or fuel cells to produce electricity. This locally

produced electricity could be used for normal electrical power requirements in buildings, supporting computers, lights, HVAC

fans and pumps, and air conditioning compressors. Many believe that once we determine how to produce hydrogen economically,

it will hold the best promise for powering our industries and homes.

EERE explains that geothermal energy is the heat from the Earth, which is clean and sustainable. Resources of geothermal

energy range from shallow ground to hot water and hot rock found a few miles beneath the Earth’s surface, down even deeper to

the extremely high temperatures of molten rock, called magma.

Geothermal hot water near the Earth’s surface can be used directly for heating buildings and as a heat supply for a variety

of commercial and industrial uses. Geothermal direct use is particularly favored for greenhouses and aquaculture. Although in

this country most geothermal resources are concentrated in the West, geothermal heat pumps can be used nearly anywhere.

With ocean water covering more than 70 percent of the Earth’s surface, it is potentially one of the largest available sources

of renewable energy. EERE reports that the oceans contain two types of energy: thermal and mechanical. Each day, the oceans

absorb enough heat from the sun to equal the thermal energy contained in 250 billion barrels of oil. As the sun warms the

surface much more than the deep ocean water, the temperature difference stores thermal energy. The conversion of ocean water

to electricity also produces desalinated water.

Mechanical energy is created from the power of ocean waves and tides. The total power of waves breaking on the world’s

coastlines is estimated at 2 to 3 million megawatts. There are many ways to extract this energy and turn it into electricity,

including similar methods to damming a river.

EERE describe solar technologies as using the sun’s energy and light to provide heat, light, hot water, electricity and even

cooling for homes, businesses and industry. Photovoltaic (PV) solar cells directly convert sunlight into electricity. We

already use a simple version of this energy to power watches and calculators. More complex systems can light houses and

provide power to the electric grid.

Solar hot-water heaters use the sun to heat either water or a heat-transfer fluid in collectors. A typical system will reduce

the need for conventional water heating by about two-thirds. High-temperature solar water heaters can provide

energy-efficient hot water and hot-water heat for large commercial and industrial facilities.

Wind energy can be captured to generate electricity, charge batteries, pump water or grind grain. Electricity can be

generated from wind turbines with two or three propeller-like blades, mounted on a rotor, that turn a generator—much as

a propeller can fly an airplane. The turbines are usually placed on high towers to take advantage of stronger, less

turbulent, wind.

Wind turbines can be used as standalone applications or they can be connected to a utility power grid or even combined with a

PV (solar cell) system. Research advances have helped drop the cost of energy from the wind by 85 percent during the last 20

years, providing greater incentive for government funding of this fuel source.


Practical Uses of Renewable Energy for Industries

The DOE’s Industrial Technologies Program (ITP) has created a variety of programs to aid in industrial process improvements.

For instance, through its Industries of the Future program, ITP is partnering with the most energy-intensive industries to

effectively plan and implement a comprehensive research and development (R&D) agenda. These vital industries—aluminum,

chemicals, forest products, glass, metal casting, mining, petroleum refining and steel—are responsible for the majority

of industrial energy consumption and represent the greatest opportunities to increase efficiency.

As an example, according to EERE, the U.S. chemical industry is the world’s largest, accounting for more than 26 percent of

global chemical production (over $450 billion per year) and nearly 30 percent of all U.S. industrial energy consumption. ITP

Chemicals hopes to help that industry achieve a 30-percent reduction in energy, water use, and toxic and pollutant dispersion

per unit of output by 2020 through cost-shared, precompetitive R&D projects that meet industry needs and help achieve

national goals for energy and the environment.

So which of the renewable energy resources will most likely affect and benefit the operation of industries in the United

States? The EIA’s “Annual Energy Outlook 2005” notes that “Despite strong growth in renewable electricity generation as a

result of technology improvements and expected higher fossil fuel costs, grid-connected generators using renewable fuels…are projected to remain minor contributors to U.S. electricity supply.” The EIA adds that renewables other than

conventional hydropower are projected to provide approximately 3.2 percent of total U.S. electricity generation by the year

2025.

According to EIA senior economist, Office of Integrated Analysis and Forecasting, Thomas W. Petersik, the slow growth of

renewable energy is due to a number of negative factors that naturally come with renewables’ processes. He explains that

renewables produce amounts of energy per unit volume that are too small, are too distant from transmission lines and

electricity consumers, and are too expensive to convert to electricity to compete with fossil fuels for grid-connected

electricity supply.

Petersik adds, “Intermittent renewables, that is, solar and wind power, suffer from uncertainty in availability—cloudy

or windless periods—no solar power at night, for example, and the general certainty in most instances that winds will

be diminished during summer peak hours. Moreover, least-cost renewable energy sources tend to be in relatively short supply,

so that once initial quantities are used, costs for additional use could rise substantially. Finally, renewables can also

present environmental challenges, such as chemical contaminants for geothermal, or dangers to fish or birds for

hydroelectricity or wind, respectively.”

That said, however, Petersik counters that in a minority of instances, EIA projections and market observation indicate that

renewables can be competitive and contribute to U.S. electricity supply—including industries—through the grid or

other method. He explains that biomass fuels such as wood sources, or geothermal or hydroelectricity resources, are known to

be very reliable.

“Where renewables can compete successfully,” says Petersik, “they offer opportunities for least-cost electricity supply,

thereby lowering U.S. industry energy costs and helping them remain competitive, providing domestically supplied energy and

domestic employment, often times also adding environmental benefits—such as cleaner air. In those instances, by

offering lower cost competitive energy supplies, renewables also substitute for fossil fuels, thereby contributing to

competition and reduced price pressures on fossil fuels in all markets.”

Petersik predicts that off-grid solar power, despite its tendency to be notably more expensive than grid power, may become

cost effective in “remote” locations—sometimes even within cities—”where the cost of extending a distribution

line to supply a small amount of very valuable power exceeds the relatively lower cost of solar photovoltaic (PV)

battery-supported PV unit,” he explains. He reports that biomass, particularly forestry and wood wastes, has provided the

U.S. pulp and paper industries low-cost fuel for electricity generation for decades. These same energy crops could provide

future electricity supplies even though “biomass gasification technologies are costly and not yet commercial—and face

significant challenges from fuel contaminants—and transportation of biomass fuels from field to generating plant

remains expensive,” he adds.

If the United States were to turn more aggressively to renewable energy, Petersik believes that biomass and wind power appear

to be the most likely sources, with geothermal power as another likely contributor for some additional supply in California,

Nevada and a few other Western states. He says there is also evidence that conventional hydroelectric

power—historically a major contributor to U.S. industrial success—might be able to contribute a significant

proportion of new U.S. renewable electricity supply. This could be done primarily by adding generators to existing dams and

hydroelectric facilities and renovating and upgrading obsolete turbines, generators and associated equipment—all

without building new dams and, in some instances, without diverting additional water. But while hydropower has significant

reliability and availability in most parts of the country, it also faces cost, environmental and alternative-use challenges.

The EIA is not a policy agency and does not set goals or advocate for them; however, Petersik summarizes, “EIA estimates and

projections all indicate that renewables can and will contribute to meeting U.S. electricity supplies, but that, like most

everything else, if the nation chooses to rely much more heavily on renewables, we will need to be willing to pay for them

and be willing to accommodate their presence in our communities.”


Related Opportunities for the Mechanical Insulation Industry

According to Gordon Hart, a consulting engineer for ARTEK Inc. with more than 25 years in the thermal insulation industry,

some renewable energy processes show promise for the insulation industry. For starters, he explains that creating biomass

power requires the use of a chemical plant—converting soybeans to diesel fuel, or corn to ethanol. As already

demonstrated in today’s chemical plants, their high-temperature operations and inclusion of large numbers of pipes and

equipment would require thermal insulation.

Solar voltaic energy shows the most promise in housing insulation and therefore shows minimal potential for industries.

Geothermal power, on the other hand, is proven to require insulation. Hart explains that geothermal “is already harnessed at

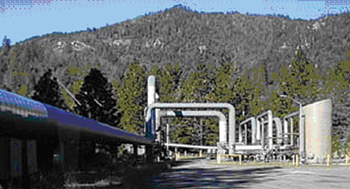
The Geysers Plant in northern California and requires the use of lots of insulation. That electrical power plant collects

geothermal-generated steam from beneath the hills and uses it to power low-pressure turbines, which in turn power electrical

generators. The plant has an overall capacity to generate 850 MW of electrical power, about equal to the capacity of a large

coal-fired plant. There are a large number of steam ‘wells’ and each of these is connected with insulated piping to larger

collection piping. (Shown in Figure 1.) Without effective insulation on the collection pipes, such as in the photo, the

process wouldn’t work.”

However, Hart explains, The Geysers Plant only provides about 4 percent of the state’s electrical power needs. The only other

major geothermal opportunity in this country is probably in Yellowstone National Park, which would require obstructing the

crowd-drawing aesthetics of “Old Faithful,” America’s oldest national park attraction.

Hydroelectric power is the oldest form of electrical power generation and an important form of renewable energy, says Hart.

Of the large number of existing hydroelectric power stations in the United States, the largest is the Hoover Dam, located

downstream of the Grand Canyon on the Colorado River, and the source of Lake Meade.

“As a hydroelectric power station, this magnificent engineering structure can generate its rated 2,000 MW of electrical

power when the lake is full,” reports Hart. “Unfortunately, the U.S. Interior Department can’t keep Lake Meade full due to

drought, steady growth in southern California since it was completed in 1935, and more recent spectacular growth in and

around Las Vegas, Nevada. You can’t use all that water and generate 2,000 MW of electrical power at the same time.”

Even more importantly for the insulation industry, hydroelectric power plants do not require the use of insulation. In fact,

no hydropower energy sources require insulation, nor do hydrogen, solar and wind sources.

Although opportunities for our industry in renewable energy technologies are limited, all is not lost, says Hart. “Renewable

energy will only be economical if fossil fuel prices remain high or continue to increase past their current levels. If that

happens, then it will become increasingly cost effective for users of fossil fuel energy to use it as efficiently as

possible. When they do, mechanical insulation will become increasingly important. Mechanical insulation typically has a

simple payback of less than 2 years: on high-temperature piping and equipment, it is as short as 1 month. When dealing with

thermal energy, mechanical insulation is simply the most cost effective means of increasing energy efficiency.”

So, although the mechanical insulation industry probably will not derive much direct benefit from the growth of renewable

energy technologies, Hart believes the same economic factors fostering the growth of renewables also will foster the growth

of the mechanical insulation industry. And if the trend for increasing fossil fuel prices increases, he says, our industry’s

future still looks very bright.

Figure 1

Just like the annoying little ghosts and goblins in the popular 1980s movie “Ghost Busters,” those pesky and sometimes

daunting-looking, all-shades-of-green mold and mildew can be hard to get rid of—a job for an experienced professional

with the right equipment.

A mold-remediation specialist can be a great friend to a business, helping to avoid potentially millions of dollars in

damage and restoration costs. When it comes to dealing with mold, ignorance is not bliss and “common sense is not always

common,” says Bill Begal, president of Begal Enterprises Inc., fire and water restoration specialists located in Rockville,

Maryland. Although a mold buster like Begal will be happy to help a business get back on track following an incident, he has

some advice to help businesses avoid making that urgent phone call for remediation.

Prevention Helps Keep the Fungus Away

The best tool in the fight against mold and mildew is prevention, Begal explains, and the best methods include having an

educated building maintenance crew and chief who do regular building walk-throughs and receiving regular visits by a

mold-remediation specialist.

Begal says that a weekly or bimonthly walk around the building to look for signs of trouble is worth every bit of time it

might take the building maintenance person. He explains that the building professional or crew are the people who know a

building the best. “They know how it leaks, how it breathes. They know the areas that have problems,” or, at least, they

should. Better yet, he adds, they should be given a maintenance budget to be able to handle problems as they arise, to deal

with them right away.

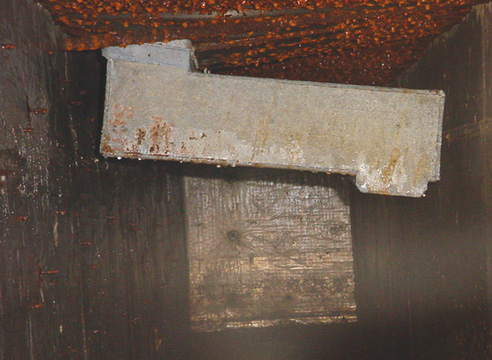
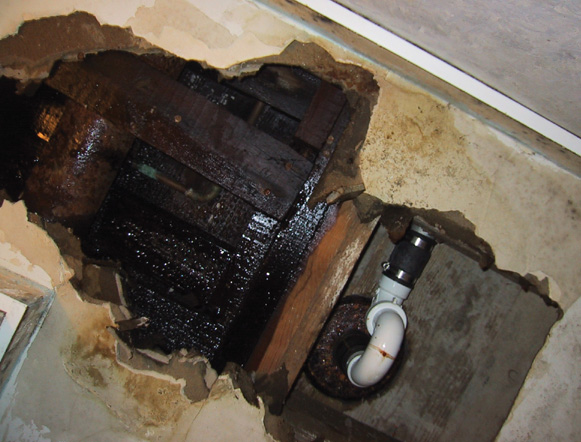
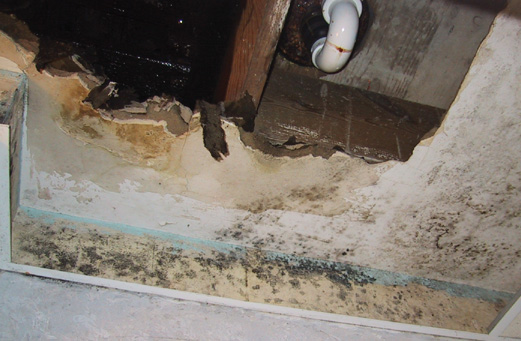
Begal even suggests that building personnel take pictures of the areas most likely to develop issues so that there are

before and after shots in case of a disaster or accident. Areas where mold is most likely to develop are any places where

moisture is most prevalent, like in restrooms, kitchen areas, roofs, near drainage pipes, near and around heating,

ventilating and air-conditioning (HVAC) units, etc. An industrial plant would also have to consider areas and pipes affected

by extreme heat or cold or high humidity. (For a complete checklist, see Figure 6.)

Mold specialists should be on the contact list—and a regular visitor—of every commercial or industrial building

maintenance crew manager, Begal emphasizes. Many restoration technicians do not know what to do. Following an incident, he

explains, “It takes knowledge and cooperation between the building staff and the technicians. I want an opportunity to walk

the building when the building is in its normal environment, not only after a disaster.”

The best complement to prevention is education. As the saying goes, “knowing is half the battle,” and that remains true

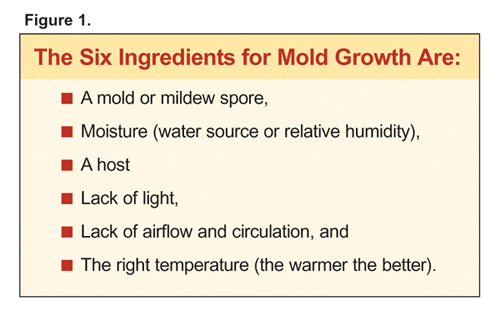
when it comes to knowing the six main ingredients for growing mold (see Figure 5). Once a mold spore enters an area, it needs

a host—any material that is cellulose. Then, it will grow and spread where there is a lack of light, lack of airflow and

circulation, proper temperature—the warmer the better—and moisture or a supply of water, including humidity.

Begal explains that an uneducated maintenance professional might turn a carpet/air blower on a wet wall or ceiling,

thinking that will fix the problem. However, a wet wall could indicate a much deeper issue, like wet insulation, and wet

ceiling tiles could involve asbestos in older buildings. Blowing asbestos into the air could create a real catastrophe,

especially for the building tenants who breathe in the contaminated air. Then, the business faces lawsuits on top of the cost

of the damage.

When maintenance staffs understand what creates and promotes mold and mildew growth, they will be better able to keep it

at bay and better prepared to address a situation or accident when it arises.

Quick Action Is Best Fix for Mold

Although Begal clarifies that not all mold is bad—think of penicillin—some mold is very bad. Once any of the

tens of thousands of possible molds is noticeable in a building, taking immediate action is the key to preventing further

damage and higher restoration costs. In his 10-plus years of experience in doing restoration, Begal claims that the worst

mistakes building maintenance professionals can make are to ignore the issue because they believe it is small or trying to

implement a “quick fix.” Again, the better a maintenance professional knows a building, the quicker he or she will notice

something wrong and be able to deal with it before it becomes a larger issue.

“If something smells, or if something is dripping or leaking, don’t just throw a bucket underneath it or a coat of paint

on it. A lot of times if you see ceiling tiles that are damaged or wall paper beginning to peel…
when it is humid or moist, so what’s causing that? The ceiling tiles are not going to get discolored all by themselves,”

explains Begal. “A lot of times, what you see is just the tip of the iceberg.”

If it is a small incident, Begal provides an example of how to respond. He says, “If you’re dealing with an ice-maker line

that breaks in a building, you cut out the wet drywall, you remove the wet insulation, and you clean the metal backs between

the walls.

You notice there is a little bit of mold on the backside of the other wall: You cut that out, you dry it, you clean it,

and you put it back up. Not a big deal. Sometimes you can do it over a weekend.”

Begal relates that it is important to realize that mold and mildew can begin to grow in as little as 24 hours and usually

after 36 hours. It largely depends on the naturally occurring environment where the building is located. A building in

Arizona will have a different mold growth rate than a building in Tampa, Florida.

But regardless of where they are working, it is Begal Enterprise’s policy that if they are involved in a renovation

project caused by a flood, and no action was taken during the first 24 to 36 hours, they cannot use the carpet blower. Using

a carpet blower can introduce positive air into the environment, promoting mold growth and blowing “infected” air around.

Instead, they use a machine that generates air, called an air scrubber, where all of the air passes through a

high-efficiency powered air filtration system. Anything bigger than 0.3 microns, which includes most dust and mold, gets

caught in the series of filters.
It is all about acting quickly and removing the key ingredients for mold survival.

No Moisture, No Mold!

Any material that is cellulose or provides a “comfy” and dark area for mold and moisture to spread and grow would make a

great host for mold growth. “In my experience, insulation, regardless of R-value, provides so many different areas for mold

spores to hang out and to grab onto,” says Begal. All areas including the insulation should be inspected for moisture. Then

the source of the moisture needs to be determined as well.

Begal adds that insulation gets much of the brunt of the damage following an incident or disaster and is often overlooked.

Just because a wall is dry, that does not mean the insulation behind it is not soaking wet. On top of that, insulation is not

easily reparable. Begal says that it can be a very tedious process to unwrap all of the insulation above a ceiling, dry it

out and re-wrap it. It is obviously important to use an insulation expert who can recommend the best insulation system for

the affected area.

Moisture can come in many different forms, and even humidity can nurture mold growth. But what people may not realize is

that there are three different types of water: clean, gray or black. Clean water is from any fresh water source, like rain.

Gray water is found in dishwashers and clothes washers. Black water is sewage water or water with decaying matter in it, also

surprisingly found in sprinklers that are not regularly flushed out.

Maintenance staff should keep good track of areas in their buildings that are prone to high moisture, especially if the

water source is gray or black and if a host is present.

When To Call in the Mold Busters

As noted, visible evidence of mold can indicate a much larger and deeper issue. If maintenance staff are not sure they can

fix the moldy area by themselves—no matter how small or large the problem appears—the best thing to do, says Begal, is to

call in a mold-remediation specialist to evaluate the situation. Specialists can give a summary of the damage and suggest

what needs to be renovated by their team of professionals versus what the building maintenance team can fix on their own.

Begal offers an example, “You could have an office building that on Saturday morning of a long holiday weekend the toilet

overflows and continues to run. You come in Tuesday morning and what started on the twentieth floor now has things wet all

the way to the seventh floor. So there is a lot of exploratory work that has to be done on all floors.”

Exploratory work is especially important following a natural disaster like a hurricane. Strong winds, changes in air

pressure and beating rain can all alter the structure of a building, especially if it had a previous weakness such as a crack

in the stucco or a hole in the roof. Anytime moisture enters a building, the most important ingredient for growing mold is

introduced.

Begal’s team investigated potential damage to a roof caused by last year’s hurricanes. “Nobody thought that there was

anything wrong with it,” he recalls. “But one little corner had pealed up, and after doing some spore sampling, we found out

the whole roof was sopping, sopping wet. And no one would have thought that the change in pressure would have been enough to

just slightly lift it, throw it off it’s normal setting. The whole roof had to come off.”

Remediation specialists wear many hats. Sometimes they are called in after a fire or flood to mitigate the loss and

prevent things from getting worse. Sometimes they help with cleanup efforts or with the insurance process. Other times, Begal

adds, he is even brought in to provide a competitive bid on a job—to confirm the necessary scope of work or cost, for

example.

Mold busters can even give direction and counsel on emergency-preparedness planning to help building crews know what to do

if a situation does arise. “We’re not just the guys you hate to call because you had a loss happen. Let us be a part of your

advance team and let us create a better association. And know that when something does happen, you’re going to be properly

prepared,” Begal says.

If your building team cannot perform a renovation, though, there are a number of criteria to consider before hiring a

company or individual to eliminate the mold.

Choosing the Best Professional for the Job

There are many different schools and courses offered to help anyone who is interested become “certified” as a mold and

remediation specialist. Unfortunately, though, informs Begal, they are not all accredited by the same association or group.

And mold is not regulated, like asbestos and lead, as a hazardous type of material because mold is everywhere—you can’t

get rid of it all.

“People who say they went to the Billy Bob School of Mold Remediation…
Well great, but who’s Billy Bob, and who taught him, and why is he the right guy to talk to?” laughs Begal. “Or I could even

make my own certificate, but what does that mean?”

You also do not necessarily want the least expensive or cheapest contractor to take care of the problem, adds Begal. Be a

smart consumer and verify the quality of the company’s work. Ask for referrals. Begal stresses that you would not hire an

employee without doing a background check on him or her.

One good indicator of a true professional or company is if they follow Environmental Protection Agency guidelines. Also,

whether the contractor has been accredited by any organization or school, and if he supports or has a membership in some

industry-known organizations like the Association of Specialists for Cleaning and Restoration (www.ascr.org) or the Institute

of Inspection, Cleaning and Restoration Certification (www.iicrc.org). Begal says “they have some classes and they have

certifications that are recognized within our industry, but again, they’re still not held to a ‘higher authority’. I wouldn’t

discount the education they’re giving; I wouldn’t discount the knowledge that can be learned.”

Begal goes a step further with his clients. He invites them to visit his facilities and witness his operations, which many

have done. He believes this not only builds confidence in his company’s ability to perform the job, but it educates clients

about what to expect if they need to call him for services.

So if your building has a mold issue, and you’re not sure your maintenance staff can get rid of the pesky stuff

themselves, “who you gonna call?” Call a mold buster. “Yeah, I know it’s expensive, and yeah, I know it can be a pain, and I

know it’s not budgeted, but people just don’t understand that if they don’t deal with it when it’s small, or as soon as they

have the opportunity, it just becomes an exponential pain…” Begal summarizes.

Be proactive, get educated about mold, act quickly and develop a working relationship with a local, trusted, experienced

professional: these are the ingredients for fighting mold.

Figure 1
Figure 2
Figure 3
Figure 4
Figure 5
Figure 6

The Manufacturers Technical Literature (MTL) program has come a long way since its earlier incarnation as the iiFile. In the past five years, it has evolved from a bulky three-ring binder to a completely digitized publication distributed via the Internet and CD-ROM, to its latest upgrade as an entirely Web-based information tool. Each year the program has improved, but this year’s introduction to the new MTL Online marks the culmination of feedback from both end users and advertisers.

MTL users will find that the search feature is greatly improved. In the past, a category search returned a list of participating companies from the Buyer’s Guide, regardless of whether the PDF files the company submitted actually fit the category searched. This company-based approach has been replaced by a more accurate file-based search. MTL participants now can choose up to three categories for each file they submit, so that when an MTL search is run you will actually get a list of files that meet your search criteria. This makes the search more intuitive as well as more efficient, enabling you to download the file immediately without clicking once more to the company detail page (unless you want to).

Users will also notice that the company detail page was redesigned. MTL advertisers now have the option of adding a brief company description to appear beneath their logo. PDF files are listed to the right under a prominent heading so users can quickly find and download them. As in the past, links to the company’s website and membership directory page appear with the listing, and the MTL files remain accessible on the membership directory page.

For the first time, non-member companies are welcome to advertise in the MTL, at a 25-percent premium, so end users may notice that these additional companies have a Web address but no membership directory link.

The most significant change this year is the introduction of MTL Deluxe accounts, which allow advertisers to add, replace, remove and otherwise alter their PDF listings throughout the year. Not only does this benefit the advertiser, but the end user will have access to the latest information at all times. A special “new” icon highlights the updated information throughout the MTL.

The CD-ROM version of the MTL was phased out this year to meet the demand for up-to-the-minute company information. CD usage was down and users indicated a preference for the Web version. Without the CD, we are now able to encourage MTL advertisers to sign up for accounts whenever they are ready—with no deadlines. The combination of all improvements has matured the MTL into a truly dynamic program.

Although end users will certainly benefit from all of these changes, MTL advertisers will benefit even more significantly. Not only is the MTL entirely online, so is the advertising process. When advertisers are ready to create an MTL account, they do so completely online?eliminating the need to burn files to a CD and mail them to NIA. The easy and convenient process begins with the creation of a user name and password, which the advertiser uses later to login and make changes to the account. Next, information is gathered about the account holder, account details are entered, an opportunity to upload a company logo is presented, and then PDF information is gathered and uploaded. Finally, the advertiser is presented with the option to pay immediately online or request an invoice. Once NIA approves the listing, the advertiser receives an e-mail notifying him/her of the published listing with a reminder about the link to the “manage my account” feature.

When advertisers wish to make changes to their account, they log in using the company name, e-mail address, and password entered when the account was created. A forgotten password can be e-mailed to the advertiser. Once logged in, the main menu displays a summary of information about the account, such as the account type (basic or deluxe), the page range chosen, the expiration date for the account, etc. Both basic and deluxe accounts contain links from this page to change contact information, password, replace a logo, or change the company description. Deluxe accounts also offer the option to delete or replace an existing PDF, add a new PDF, or change PDF listing information, such as the title displayed or the search terms for the PDF.

The NIA hopes that a variety of Web-based ads will help spread the word about the MTL and continue to expand its usage. We hope that both advertisers and users are pleased with the new MTL online as it fulfills its mission to connect people to the most up-to-date product information available in real time.

To subscribe to the new MTL and MTL Deluxe go to www.insulation.org/MTL/Ads or contact our advertising sales manager, Brendan Campbell at 571.261.2377 or BCampbell@insulation.org. To search the MTL by category, go to www.insulation.org/MTL.

Coal is trying to clean up its image and developments in technology along with public and private investment are making progress possible.

Pressures to clean the air and water are only going to get more intense, and with coal supplying more than half of the fuel needed to create electricity in the United States, it’s only appropriate that it attract the most scrutiny. Indeed, modern innovations are on the way and purportedly help cleanse coal before it is burned—developments that may soon be partially underwritten by the U.S. government.

“This is all very real,” says Michael Morris, CEO of American Electric Power (AEP) in a personal interview. “These technologies are shown to work and will go a long way to cutting the level of harmful emissions by coal plants.” AEP is not just spending
$1.2 billion over the next three years to install scrubbers that will reduce its sulfur dioxide releases, but it is also expected to build a coal gasification plant that washes the impurities from coal before it leaves the smokestack.

When coal is burned, it produces sulfur dioxide and nitrogen oxide—the stuff that produces acid rain and smog—as well as particulate matter and mercury. Under the government’s Clean Air Act, those pollutants must be removed from exhaust gases that come out of the smokestack on the backend. And that requires expensive technologies that produce varying results. At the same time, the combustion of coal also produces substantial quantities of carbon dioxide, which is not currently regulated, but the pressure to do so is increasing.

By contrast, coal gasification removes the sulfur dioxide, mercury and carbon dioxide from the “syngas” before it is combusted, say experts. And because the syngas is cleaner than raw coal, lower quantities of nitrogen oxide and particulate matter are produced during the combustion or burning process, they say. The carbon dioxide is more concentrated, which makes it easier to capture and seize. Four such plants are operating now: two in the United States and two in Europe.

Cinergy is now in negotiations with General Electric and Bechtel Corp. to design and construct a coal gasification plant in Indiana. All the paperwork should be signed by year-end. Beyond that, it will take about four years to build the generation facility, which will take an existing 160-megawatt coal plant and convert it into a modern 600-megawatt coal gasification facility.

“We need to get a few commercial gasification plants deployed that operate well so that we can get the comfort level up,” says David Denton, with the coal gasification services unit of Eastman Chemical Co. in Kingsport, Tennessee, that manages, operates and maintains such plants for owners. “Compared to conventional coal combustion plants, gasification plants have lower variable dispatch costs and they are more efficient—and without the additional environmental costs associated with cleaning up post-combustion exhaust gases.”


Tight Restrictions

Certainly, the Clean Air Act of 1990 placed much tighter restrictions on emissions and in doing so, gave natural gas a competitive advantage. But natural gas supplies are dwindling and strict regulations mean that developers have a difficult time accessing supplies. Coal, by comparison, is cheap and plentiful with more than 200 years worth of reserves in the ground. And while natural gas will gain market share, the expected increase in future demand will actually lead to greater overall coal usage—not less.

In fact, about 90 new coal plants with a total capacity of 50 gigawatts are under consideration. Today’s coal-fired plants have a fuel-to-efficiency rate of 33 percent to 35 percent. With the new technologies, such as gasification, however, that efficiency rate is said to increase to 40 percent to 50 percent, and potentially as much as 60 percent. The cost to build: about $1,200 to $1,600 per kilowatt compared to $900 with conventional coal plants.

Some utilities and the vendors that supply clean-coal technologies are asking the government to get more involved. The added risk means that government must take a role in bringing such ideas to market, they say, which includes more money for research and development and even production tax credits. Now, the United States is pushing its FutureGen plan that will build a $1 billion coal facility that is expected to sequester all emissions, including carbon dioxide thought to cause global warming.

The need to make coal cleaner is greater now than ever before. As developing nations evolve and their needs become increasingly sophisticated, their demand for power will also escalate. And while other parts of the world have greater access to cleaner burning fuels such as natural gas, they too will rely more increasingly on coal as a fuel source—only necessitating that these new technologies get over the hump and into the market.

“The rest of the world will catch up,” says Charles Bayless, president of the West Virginia University Institute of Technology. “My view is that the U.S. will switch increasingly to coal,” the former CEO of Tucson Electric adds. Meantime, others from around the world may also turn to coal, particularly as clean-coal technologies evolve.


Energy Picture

Environmental and other civic groups, however, are admonishing the U.S. government to steer away from a coal-centered philosophy and toward a sustainable energy future. The logic: coal emits more carbon dioxide, mercury, nitrous oxide and sulfur dioxide than competing fuel sources.

Without such constant reminders, industry and government could become complacent. But realism tempers those demands, recognizing coal for its current role in both the global and domestic energy mix and realizing that green energy sources like wind and solar won’t replace it anytime soon. Indeed, pragmatics suggests that the nation needs a portfolio of fuel sources to hedge against price fluctuations and energy shortages.

Those in the utility industry and under the supervision of government will continue to hack away at coal emissions. In fact, the expected future cost to comply with the Clean Air Act is about $60 billion over the next several years. That’s on top of the $50 billion that’s been spent since the 1970s—efforts that have produced tangible environmental results.

In return, the utility industry is asking for more public support at the state and federal levels. That includes everything from
allowing them to put the cost of new technologies—such as coal gasification—in their rate bases to giving them new funds for research and development, (all part of the energy bill recently passed by Congress).

Fossil fuels and specifically coal will remain an integral part of the energy picture for the foreseeable future. But such market dominance means that the coal industry must continue to work to clean up its act and to convince a waiting marketplace that it can breathe a little easier.

There are two primary reasons for petrochemical facility owners to consider an energy appraisal: to reduce cost or to increase productivity, both of which should increase profits.

Many forces have emerged since 1970 that make industrial energy consumption more challenging. Today’s industrial energy decisions must accommodate changes in technology, increasingly stringent emissions regulation and volatile energy markets. To offset these forces, manufacturers now must manage both their procurement and consumption of energy on a continual basis. Plants of all types, sizes and locations use energy, so the potential for energy-driven productivity gains is everywhere. The benefits only begin with reduced energy bills. Energy efficiency is an indispensable component of any effort to improve productivity. Ultimately, energy efficiency contributes to wealth.


Energy’s Role in Manufacturing

Energy allows manufacturers to transform raw materials into final consumer goods. Raw materials pass through a number of intermediate stages that represent the bulk of industrial energy consumption. In an economic sense, energy performs work that adds value to intermediate products as they are progressively transformed into final consumer goods. Opportunities to improve energy efficiency occur at each step of the manufacturing process.

A recent U.S. Department of Energy (DOE) analysis of industrial energy use and loss concludes that only 43 percent of all manufacturing energy inputs are applied to process work. The remainder is lost mostly to conversion as energy is transformed from fuel to power to heat and, finally, to work. However, industry pays for all energy consumed, whether it is used or wasted. The recovery of lost industrial energy—to the greatest practical extent—is an opportunity for U.S. manufacturers to improve financial performance in a globally competitive marketplace.


Energy Efficiency: Boosting Revenue Through Greater Productivity

If industrial facilities do not optimize their energy consumption, opportunities to create value are lost with energy waste. Energy waste plus the forfeit of additional revenues have a two-fold negative effect on earnings. Energy-efficiency refers to technologies and standard operating procedures that reduce the volume of energy per unit of industrial production. Manufacturers selectively implement energy efficiency initiatives for their potential to reduce expenses, build revenue capacity and contain operating risk.

Facility managers need to understand how energy efficiency supports overall corporate goals. The very activities that provide energy efficiency also provide better control over plant assets and inputs. For example, energy-efficient practices ensure that thermal resources are applied at the right temperature, for the right duration and in correct proportion to raw materials. This control reduces a facility’s scrap rates as well as energy consumed per unit of production. Control provides reliability. Greater reliability means less down time. Less downtime means orders are filled faster, allowing a facility to complete more orders over the course of a year—thus making more revenue. Energy efficiency is not just about reducing utility bills. It is also about boosting revenue through greater productivity.

A combination of new technologies and the optimization of current assets and practices are required to reduce energy consumption. Estimates provided in several industry studies indicate that, on average, 10 percent to 20 percent of industry’s energy consumption can be economically avoided. Remember that 10 percent to 20 percent represents “average” savings. Some plants will experience greater savings, some less.

Good energy decisions can reduce certain non-energy expenses as well. In a 2002 U.S. Environmental Protection Agency (EPA) white paper, a summary of 77 case studies gives some indication of the value of non-energy benefits attributable to energy efficiency in a manufacturing setting. Of the total number of cases, 52 included a monetized estimate of both energy and non-energy savings. Based on energy savings alone, project paybacks in aggregate were 4.2 years. With non-energy benefits included, the aggregate payback was 1.9 years. It is also interesting to note that 41 of the 77 cases involved “state-of-the-art” technology installations, while 35 involved everyday, conventional technologies. As a subset, the conventional technology case studies displayed a 2.3 year payback on energy savings alone, while the inclusion of non-energy benefits dropped the payback to just 1.4 years.


The Role of Government Policies and Programs

In the United States, the national government plays an important role in promoting energy efficiency in the private sector. For example, the DOE, with substantial help from federally chartered national laboratories, has been effective in advancing research and development (R&D) for energy-efficient technologies. Recently, DOE’s Industrial Technologies Program—and earlier programs—published BestPractices technical reference materials to help plant managers develop their own strategies for improving energy efficiency. State governments often follow DOE’s lead on energy priorities and draw on DOE grants to implement programs at the state level.

The EPA also has program activities that seek to promote energy efficiency and to address financial, marketing and community relations issues (www.energystar.gov/index.cfm?c=business.bus_index). The EPA’s services include a clearinghouse of information to help businesses select, evaluate and receive recognition for energy-efficient improvements.

Utility deregulation is another policy variable affecting industrial energy use. Reliable, plentiful energy has long been taken for granted as a key feature of the U.S. economic infrastructure. That advantage is at risk today. Since the 1980s, the progressive deregulation of U.S. utility markets has permitted more large energy consumers to shop for fuel and electrical power in competitive markets. However, deregulation also dismantles the mechanisms for market-wide investment planning of in utility infrastructure. These investment decisions are increasingly left to the free market. As a result, underinvestment progressively compromises utility services in some regions of the country where assets reflect age and capacity limitations. Energy efficiency practiced by large industrial consumers, therefore, not only lowers their energy consumption costs, but also helps reduce stress on overburdened utility distribution systems in their communities.


The Role of Technological Innovation

Manufacturers recognize technology as the primary driver of industrial productivity, which in turn drives the rest of the economy. From 1977 to 2002, productivity in the U.S. economy overall rose 53 percent, while U.S. manufacturing productivity rose 109 percent. Investments in information technology are estimated to account for 60 percent of the increase in manufacturing productivity.

Energy applications compete with information technologies and other activities for industrial R&D budgets. For the past 20 years, industrial R&D has favored refinements of existing products and production facilities. This reflects industry’s preference for lower, short-term risks and a more immediate return on investment. But this focus is at the expense of developing next-generation technologies that will ensure long-term industrial competitiveness. Certain energy-efficient technologies face developmental hurdles because of industry’s investment priorities. To facilitate overall U.S. industrial R&D, the DOE’s Industrial Technologies Program partners with industry to identify, sponsor and develop new technologies.

Industry’s best R&D options for reducing energy costs were summarized in a study sponsored by the DOE. This study identifies energy efficiency opportunities that yield energy, economic and environmental benefits primarily for large-volume, commodity/process industries. Opportunities were prioritized to reflect the magnitude of potential savings, broadness of suitability across industries, and feasibility to implement. In total, these energy-saving opportunities represent 5.2 quadrillion Btu—21 percent of primary energy consumed by the manufacturing sector. The savings equate to almost $19 billion for manufacturers, based on 2004 energy prices and consumption volumes. Table 1 summarizes these leading opportunities.

It is very important to note that this summary describes savings for the U.S. manufacturing sector as a whole. Individual manufacturing facilities have unique designs, operating protocols and maintenance histories, all of which affect energy-saving potential. Individual facilities may save more or less than the industry average.

Note that about 30 percent of the potential savings (1.4 quadrillion Btu) described in Table 1 are derived from “best practices,” which are generally low-cost opportunities to reduce the energy consumption of existing assets. Best-practice savings come from changes in behavior and procedures. Insulation optimization would be included in best practices. Facilities that sustain energy best practices can use the cash flow of savings to underwrite the cost of capital improvements that save even more money. Manufacturers investing in best-practice training can think of it as “intellectual R&D”—knowledge and skills that save energy with today’s assets while preparing the workplace for the next generation of advanced technologies.

The other 70 percent of potential savings in Table 1 are equipment upgrades that typically require capital expenditure. Some of these are currently high-cost capital items, and not yet fully commercialized, so they are ideal elements for the DOE’s R&D agenda. These investments may be most feasible as a part of the construction of new facilities.


Energy Efficiency Is Not Limited to New Technologies

Energy-saving technologies are not limited to commodity/process facilities. A study released in 2001 by the American Council for an Energy Efficient Economy (ACEEE) offers a list of 54 emerging technologies (refined from a longer list) that offer the most potential return value to industry through energy efficiency. Many of the 54 technologies apply to specific industries. Others are widely applicable, and feature a variety of well-proven, low-risk technologies. The four technologies highlighted here were selected because they: 1. are broad in their potential application and are not industry specific; 2. represent large savings potential, due in part to their broad applicability; and 3. offer additional non-energy benefits, such as enhanced productivity, product quality or workplace safety.

Emerging advanced listing technologies have the greatest likelihood of success, with a simple payback of 1.3 years—”payback” referring to the number of years it takes for an investment to pay for itself through the savings it creates. The four other emerging technologies with the lowest cost and quickest payback opportunities are: advanced lighting design, with a payback of 3.0 years; compressed-air system management, with a payback of 0.4 years; motor system optimization, with a payback of 1.5 years; and pump efficiency improvement, with a payback of 3.0 years. While all four are considered to have a medium likelihood of success, the chances of the last three could be enhanced if complemented by improved procedures/behavior.

Industrial energy efficiency is not limited to exotic, new technologies. Note that the opportunities listed here—related to lighting and electric motor-drive systems—are routine technologies that pay for themselves quickly though the savings they generate. As energy prices rise, the payback on these opportunities becomes even more financially attractive.

Why would routine, everyday technologies top the list of energy-efficiency opportunities? Because powerhouses, which host energy support systems such as steam, air compressors and other “prime movers,” remain literally on the periphery of management attention. This fact is underscored by the typical physical layout of industrial properties. For historic engineering safety reasons, the powerhouses that perform combustion duties are isolated from the structures that host core processes. Energy systems are secondary to manufacturing activities that make money. Alliance research indicates that the remoteness of industry’s powerhouses—both physically and managerially—is why they get only the remainders of budget authority and talented investment analysis. Taken for granted year in and year out, these common plant utilities become a stealthy drag on financial performance as their integrity is allowed to slip.

Industry’s near-term energy-saving opportunities come from best practices (behaviors and procedures) applied to current energy systems. A company’s investment in energy training and skills also helps to reduce the investment risk associated with new technologies.


Energy Efficiency’s Impact on Business

What financial results can a company expect from energy management? Industry surveys from 2002 indicate that the average plant can reduce its energy consumption by 10 to 20 percent, and much of that is from procedural and behavioral changes.
The cost of sustaining an energy-management program (operations and maintenance costs only, omitting capital expense) is around 1 to 2 percent of total energy expenditures.

Energy management usually provides savings through a number of ways: 1. reduced fuel use; 2. reconciling errors in utility bills; 3. using consumption information to negotiate better fuel purchase contracts; and 4. reducing raw materials waste, attributable to the enhanced precision of energy use. In addition to savings, many manufacturers enjoy the additional revenue generated from current assets when energy waste is captured and redirected back into process activities.

Energy management is a process of continuous improvement. Initial savings pay for subsequent rounds of improvement. Companies that develop best practices with current assets are more capable of absorbing new technologies. There are scale economies in waste management—the discipline that saves energy can be extended to water and materials consumption.

Energy management bears a striking resemblance to financial planning:

  • Identify goals;
  • Select the investments needed to reach the goals;
  • Establish a blueprint and strategy for goal attainment;
  • Start early, if only with small efforts;
  • Maintain regular contributions over time;
  • Keep track of earnings; and
  • Defeat risk through reinvestment and diversification of earnings.

“Diversification” means expanding beyond one-time energy projects to make energy management part of standard operating procedures—bumper to bumper—throughout the organization. The financial and energy-planning analogies share the same result—the growth and preservation of wealth.

Today’s forward-thinking corporations improve their business performance through better stewardship of energy and other resources. This strategy allows companies to improve their income performance while reducing operating risk. It is imperative that people working in today’s industries learn waste minimization principles.


Closing Thoughts: Insulation and Today’s Energy Markets

On August 8, 2005, President George W. Bush signed into law the first federal energy policy act since 1992. Is it what industry wants? The energy production and utility industries will answer “yes.” For industrial energy consumers, the answer is maybe. We may or may not see increased energy supply (and lower energy prices) as the result of relaxing the regulatory restrictions imposed on energy producers. Most of us will simply wait and see.

Today’s forward-thinking corporations improve their business performance through better stewardship of energy and other resources. This strategy allows companies to increase income while reducing operating risk. Energy management is additional work for folks working in industry, and it is best pursued through a business plan for identifying, evaluating and prioritizing improvement opportunities. At world-class manufacturing companies, the staff conducting this extra work pay for themselves several times over both in energy savings and productivity improvements.

Even the most elaborate energy management plans have to start somewhere, and therein lies the biggest opportunities for promoting insulation through the rest of this decade. In-house energy programs need a few quick-payback, easy-to-do victories to gain momentum and support from plant staff and managers. Insulation is a prime example: It is a low-cost, non-capital item. From the user’s standpoint, it is not maintenance intensive. Install it, and leave alone—it does not need to be constantly adjusted, tuned or monitored—as long as it is properly sealed. Except for proper sealing, it does not add to facility staff’s daily operational chores.

If a company’s energy management program is going to be at all sustainable, however, someone must absolutely monitor fuel use before and after individual projects are put in place. The key to this is obtaining an energy audit prior to taking action. Every facility should know how much fuel, power, water and other key inputs are required to make a unit or batch of its products. After all, you can’t manage what you don’t measure. The manufacturers that survive in today’s globally competitive markets will be those that understand and control their costs. Energy waste is not part of a successful business formula. Insulation is a part of the solution.

Figure 1

Understanding or preparing an insulation specification for a high-temperature insulation system is not a simple procedure. It is, in fact, a very complicated process involving multiple variables and the making of many engineering choices. The biggest fallacy is that one specification can work for all situations.

A well-written specification must convey to the installing contractor or personnel, clearly and without exception, the intent of the specification. It must provide the information necessary for the installation to proceed, but does not have to state what is not required. It must list only the things required for the proper installation and supply of the insulation system as defined by the scope. Lastly, a well-written specification will serve to establish proven standard methods of construction.

Regardless of how thorough the specification is written, however, it will not always be practical to cover every conceivable detail that may arise. As is the case in all phases of construction, good common sense and judgment must be exercised in conjunction with any specification. Alternative designs will always be available and can be submitted as options.

An insulation specification should be broken down into four major sections: scope; general conditions; material specifications; and application specifications. The following is considered the minimum requirements per section for a well-written specification.

Section I—Scope

This section should set the boundaries of the work within the specification. It can be relatively short and can be done by a written description, key arrangement drawing or quantitative take-off. Some examples to use for the descriptive scope are:

  • These specifications cover the insulation material and application for the surfaces outlined on the following pages and in accordance with the reference drawings.
  • These specifications cover the insulation material and application for the re-insulation of the entire secondary super heater legs and headers inside the penthouse area.
  • These specifications cover the insulation material and application for the insulation of the economizer casing and associated connecting piping.

Providing a quantitative take-off in the specification is the best way to define work scope. A take-off detailing area by area along with the specific materials and attachments required will eliminate any questions such as: “What materials are required to be used in a specific area?” and “What exactly are the scope limitations?”

Some of the advantages for including a quantitative take-off as the primary means of defining scope are that the defined scope eliminates any misunderstandings that could have an impact on or delay the project during the installation. The defined scope allows the bidding process and the evaluation of the bids to go quicker and easier because the contractors are bidding to the same work scope. It assures that the bid package is complete because the quantitative take-off would point out if there were a drawing or a detail or a question that needed to be clarified prior to the specification going out to the contractors.

The defined scope would act as an actual contract document of what is, or should have been, installed for future reference if problems occur later on. It could be used as historical data for future projects. The defined scope could then be used at the job site to monitor the work being installed quickly and easily, even by those non-experts in the field of insulation.

All of the above are very good reasons to include a quantitative take-off as a scope-defining document. However, the most important reason is that you can estimate material and labor costs before the contractors submit the actual bids. This way you will know exactly what should be a “fair and reasonable” bid. Having your own internal numbers will help in the bid evaluation process. By providing a quantitative take-off with the specifications to the contractors, you have a better chance of getting the project done under budget with far fewer questions and problems during the installation.

Section II—General Conditions

This section should clearly specify what the job conditions are relating to storage, warehousing and responsibilities. It should also tie the specifications to the actual contract agreement that may exist between the customer and the installing contractor. Some examples are:

  • These specifications are to provide for the economic application of the insulation material.
  • Questions concerning application methods as specified in this contract are to be resolved with the company prior to the signing of this contract.
  • The contractor, upon signing this contract, covenants and agrees to the requirements of this contract.
  • All materials required for the proper support and fastening of the insulation system shall be installed by the insulating contractor and be of such quality to be suitable for the purpose intended.
  • Where application drawings differ from actual contract drawings, written specifications, key arrangement drawings and section drawings, the insulation contractor will follow the latter.

Section III—Material Specification

This section must clearly specify what materials can be used. A material can be specified by what it is made of and the manner in which the material was manufactured (e.g., a cellular glass product). A material can be specified by the manufacturer and trade name or number (e.g., XYZ Board Insulation). Lastly, it can be specified by its generic classification and its properties (e.g., mineral wool board ASTM C-612, Type IVB, nominal 8-pound density).

Section IV—Application Specification

This section must state or clearly show by a written specification and/or by application drawings the minimum requirements and accepted standards for applying the insulation. This information will be used as a guide to apply the insulation to the scope of work shown on the actual contract design drawings.

An example of a well-written specification defining application is:

Install 1½-inch-thick mineral wool blanket insulation wired to the secondary super heater tube sections and headers. Where the tube or section spacing is greater than 9 inches, an inner support shall be utilized. Refer to material specifications for approved insulation materials, lacing wire and insulation support. All blanket edges must be sewn together.

Conclusion

It is estimated that in the next five years, the power-generating industry will spend in excess of $35 million to repair or completely replace the insulation (and lagging) that has already been installed on their steam-generating boilers, selective catalytic reducers and other air pollution equipment due to improper installation and design. Many of these errors could have been avoided if a well-written specification had been provided. Having the right specification for the project is the first step to a good installation. Proper installation begins with a clear and defined specification and, if installed correctly, will always end in energy savings.

  
Click Photo to Enlarge

Figure 1

Figure 1

Writing an insulation specification for high-temperature applications, such as insulation systems at power plants, can be a difficult job.

Figure 2

Figure 2

Downcomer insulation with the wrong size pipe insulation. Notice the packing and the location of the joints.

Figure 3

Figure 3

Furnace wall insulation.

Figure 4

Figure 4

Furnace wall insulation with gaps between the board insulation.

Figure 5

Figure 5

Furnace wall insulation with insufficient insulation pins.

Figure 6

Figure 6

A drawing of pin spacing application.

Figure 7

Figure 7

Furnace wall insulation with irregular pin spacing and pattern.

Figure 8

Figure 8

A 799 F downcomer with insulation being applied.


One of industry’s biggest—and most misunderstood—business opportunities is therecovery of income lost to energy waste. Out of 17.8 quadrillion Btu of fuel and electricity delivered “to the fence” of industrial facilities in 2001, a conservative estimate claims that 31 percent (5.4 quads) was lost in combustion, distribution and energy conversion activities. At today’s fuel prices of about $7 per MMBtu, those losses equate to more than $38 billion. Table 1 presents an overview of the U.S. industry’s energy use and losses in 2001.

The fundamental laws of physics and thermodynamics make some losses unavoidable, but much of this loss is an opportunity to embrace efficient technologies and practices. Every 1 percent recapture of energy losses saves industry about $380 million. Estimates of practical energy savings available to industry range from 10 to 20 percent. Note that this is an industry average—some plants can save more than this range, some less. Keep in mind that each dollar of energy cost savings is one extra dollar of net income.

Case studies and research conducted by the Alliance to Save Energy have articulated industry’s energy management barriers and strategies. The Alliance shares some major lessons:

  • Technology is crucial to achieving energy efficiency, but many plant managers are not fully convinced even by impressive site demonstrations. This is especially true when managers feel that risks are involved.
  • Information is crucial to adopting energy-efficient solutions. But the best of engineering proposals, cash flow projections and even outright public grants cannot always overcome the barriers that manifest within manufacturing organizations.
  • Top management direction does not always ensure that energy efficiency will be effectively carried out. The conflicting accountabilities that arise from a lack of cooperation across departments and production facilities within a company must first be recognized, and then circumvented.
  • Energy management is a process, not a project. Sure, engineering hardware projects are part of the solution, but energy-smart behaviors, folded into standard operating procedure, represent about 30 percent of potential energy savings.

The barriers to industrial energy efficiency include lack of awareness, lack of cross-departmental cooperation, outdated accounting techniques, restrictive budget and financial criteria, lack of management accountability, and lack of resources and complacency. We will take up a spirited discussion of these in next month’s column.

Your questions and comments are welcome. Please reply with your energy management question, concern or story. I’ll respond to each, and publish the more provocative discussions in this column. E-mail crussell@ase.org, and please include your phone number if you wish to discuss the item prior to publication.

On the horns of the dilemma.”
—George Santayana

dilemma: de-‘le-ma, noun—an argument presenting two equally conclusive alternatives

Trace the word “dilemma” back to its Greek origin, and you’ll find that the word dilemma means “two assumptions.” Two assumptions, or conditions, that are both true—and in opposition to each other.

Here’s an example of a dilemma that anyone who has ever been involved in an accident investigation can well appreciate. Having everyone involved in the event tell you everything they know—including what they did wrong—is essential to finding out what went wrong. But everyone knows all too well that, when they tell you what they did wrong, they’ll get in trouble.

That means that managing the investigation also requires managing a dilemma. It is this dual nature of the dilemma, and the tension it produces, that led to Santayana’s description. You don’t need a warning label to know that those horns are sharp, and are capable of producing a severe injury—literally and figuratively.

The Rational View

We can already hear the guns being loaded by our good friends who disagree with the notion of “equal and opposing conditions.” As rational managers, they know there is bound to be a solution to every problem, even the most difficult. All it takes is time and brainpower.

This we know from firsthand experience, having made the argument a few times ourselves. But the school of hard knocks has taught us that it doesn’t always work that way. Life is not governed by the laws of reason and logic. Reality can put even the most rational and logical of managers and supervisors on the horns of the dilemma. Here are a few safety dilemmas we’ve seen—and experienced.

There are occasions where the supervisor doesn’t recognize that he’s living on the horns of the dilemma. There, the dilemma is subtle; the supervisor knows something isn’t right, but isn’t sure exactly what that is. “My boss tells me that I’m accountable for the safety performance of my crew. But there’s no way in the world that I can possibly control what they do&mdashmost of the time I’m not even out there with them. But try telling that to my boss. He doesn’t want to hear that.”

It’s this situation that is the source of significant frustration for line supervisors and managers. The supervisor blames it on a communication problem, a difficult and demanding boss, or the kind of people and work he supervises. But, since none of these culprits is likely to change, the situation is hopeless. The easiest way out of this dilemma—or so it seems—is simply to ignore it and hope nobody gets hurt.

Ignore it or not, the truth is that what’s in play is a classic managerial dilemma. It’s one of the very first dilemmas many of us experience after being promoted into management: We go from being accountable for what we do, to being accountable for what others do.

In other situations, the dilemma is obvious, leaving the manager to deal with a problem that proves incapable of solution. Picture it this way: At the end of a long and largely unproductive accident investigation meeting, a team member blurts out: “Hey, I thought management said that all injuries are preventable. So, how in the world could anyone have ever prevented this injury? The guy just lost his balance and fell down the stairs. Sometimes stuff happens.” Try answering that question!

There are some dilemmas that can only be appreciated by taking the time to contemplate and analyze. Unfortunately, that function is normally reserved for philosophers and academics. Managers are far too busy to waste time in this pursuit. That may be good news, at least as far as keeping your sanity. There are dilemmas that usually go unrecognized.

Here is an example of what we mean: “Safety really boils down to the management of risk. Probability and consequences can be calculated. With human endeavor, the probability of error will never be zero. That being the case, accidents will be predicted to occur on some frequency, however small. But we said we believe all injuries are preventable. And I happen to think that is right.”

If you hadn’t put your good thinking to the task, you’d never realize this dilemma existed in the first place.

Managing safety performance requires us to manage safety dilemmas, whether they’re real or imagined, obvious or subtle. They have to be managed in some way.

What do you say to the guy asking the question during the investigation meeting about preventing all injuries, particularly the one that seems unpreventable? How do you manage risk without going along with the consequences of probability? How do you manage what you can’t control?

Much of the time, the answers given to these dilemmas aren’t very good. We see it in the classes we teach. The body language from the participants is a dead giveaway that the answer doesn’t fly.

Of course, when the answer comes from the boss, there is seldom a dissenting opinion. At least not then: Comments are saved for later, such as, “Can you believe what the boss said this morning? How could he be so clueless?” That boss comes off as a character out of the cartoon Dilbert. More significantly, the opportunity to make sense of a complex situation&mdasha moment of high influence&mdashis lost. There must be a better way.

There was once a very bright and sincere young man who occasionally used the dilemma as a tool for teaching. He would pose a scenario, and then follow with good questions. His approach happens to be one of the most widely published and read of all teaching techniques. These scenarios can be found in the Bible.

As Paul Harvey would say, “That’s the rest of the story.”

We all know from our personal experience what a great idea this is for teaching values. We believe it is also a very good way to think about how to manage safety performance better. We’ll be putting the technique into play in this series of articles called “Managing Safety Dilemmas.” We’ll pose the scenario, describe the dilemma and make the arguments for the competing cases. Then, we’ll weigh in with our take on what to make of the dilemma.

Remember, we are talking about real dilemmas: Don’t look for comforting solutions. The real value from the exercise comes from thinking about the situation, describing the dilemma, and appreciating the tension that exists between both sides.

Finally, we hope our writing will spur you to join the dialogue. We’d love to hear your view on both sides of these dilemmas. It’s easy; you can weigh in our discussion forum at www.balmert.com and see what others are saying, or just send us an E-mail.

The Accountability Dilemma

“To be a tourist is to escape accountability. Errors and failings don?t cling to you the way they do back home.”
—Don DeLillo

Our series begins with a dilemma familiar to anyone who’s attended one of our Managing Safety Performance classes: Let’s call it the accountability dilemma. Early in the career of every new supervisor, he comes face to face with this dilemma. While it applies to all of the supervisor’s responsibilities, we’ll examine it in the context of managing safety performance.

Remember, every dilemma has two competing assumptions or conditions. The accountability dilemma is best summarized by two questions: 1. How much control does a supervisor have over the safety performance of those he supervises? and 2. How much accountability does a supervisor have for the safety performance of those he supervises?

The difference between what a supervisor controls and what a supervisor is held accountable for creates the accountability dilemma. Looked at another way, the supervisor is expected to do the impossible: manage what he cannot manage. No, that is not a misprint!

Every boss is expected to control and influence the actions of subordinates—over which he does not have complete control or influence. This phenomenon is not limited to managing safety performance, or even managing an industrial operation. Every boss in every line of work experiences it. Take the position, “Head Coach, Professional Football Team” as an example.

Remember Danny White? At one time in his life, he was employed as quarterback for the Dallas Cowboys, playing under a fellow by the name of Tom Landry. More recently, he was found pacing the sidelines of an Arena Football League team as head coach of the team. Here is his take on the issue of control and accountability: “As head coach, you feel a lot more responsibility with a lot less control in terms of the game. It can be frustrating. I’m the architect who designs an offense to defeat the defense. I put the plan out and rely on the players to execute it.”

This sounds familiar to those of us in the business of managing operations. So does the fact that football players don’t always run the plays the way they should. “As a former player, many times I want to run out there and show them how to do it. But I can’t.” We all know how that feels.

The truth is that everyone in management—from sergeant to supervisor—faces the accountability dilemma. It is the most fundamental dilemma of management, one that has caused more than a few to seek other employment. The greater the gap between responsibility and control, the greater the stress.

If you’re thinking that there is a way to make this one go away, you’re in for a disappointment. The reality of the accountability dilemma is that there is no solution. No one gets to reprogram the computer, or change the rules of engagement. But that doesn’t mean the situation is hopeless or unmanageable: There are ways to lessen the stress this dilemma produces. Here are four ideas that can help.

Idea Number 1: Recognize that you really are on the horns of the dilemma.
Pretending that the dilemma doesn’t really exist will only make things worse. Your boss will hold you accountable if someone working for you gets hurt. Don’t expect anything different. You’ll never succeed in controlling what those working for you choose to do. Don’t waste valuable energy trying to “get control.” It doesn’t work that way.

There will always be a gap between what the supervisor controls and is held accountable for. That doesn’t mean there isn’t anything that can be done to shrink the size of the gap. The trick is to know where to spend the effort to do that.

Idea Number 2: Call the dilemma by its proper name.
Naming something provides all sorts of useful benefits. The name gives you perspective: This isn’t really all about you. Every boss faces the accountability dilemma. Naming the dilemma invites the opportunity to put the dilemma up on the examining table and probe around for symptoms.

With a name, you know what to look for, and how to treat the symptoms. Note that we did not say, “Cure the problem.”

Idea Number 3: Lead better.
The best opportunity to deal with the accountability dilemma, taming it to the extent possible, is to make the gap between accountability and control as small as possible. Of course, nobody controls other people. So, a better way to think about what many supervisors call “control” is to think about it as “influence.” There are things that every supervisor can control, but they are things, not people.

Dwight Eisenhower, as the general, once remarked: “Leadership is the art of getting someone else to do something you want done, because he wants to do it.” The best leaders manage to do that, and do it so well that the gap between control and accountability is very small.

So, lead better. Look at your own behavior and performance as the leader; measure it, and see what needs to be improved. Then set out to improve what you can control—your own behavior as the leader. Do that, and the gap will be lessened.

While you’re working hard at leading better, realize that there is no such thing as a sure thing. The better the leader, the lesser the gap. But even the best still see the gap, and that can be the cause of frustration. Just ask Bill Parcells, head coach, Dallas Cowboys.

You know all about Bill: Super Bowl appearances with three teams, and two victories. He’s going nuts up in Dallas right now, because he’s got players that don’t seem capable of executing out on the field. But we suspect that it is just a matter of time—and the draft—before he fields a team of players who execute the way he expects.

Idea Number 4: Look to your team.
If the leader doesn’t have control over the actions of those he supervises, who does? The answer, of course, is the individuals themselves. The very best safety leaders we have seen in action have been successful in convincing their team members that they’re the ones ultimately accountable for the results. When it comes to safety, the people doing the work have the most to gain or lose.

Viewed in this light, there isn’t an accountability dilemma. The people doing the work have both control over what they do and the greatest accountability for what results.

So, if you can figure out how to make individuals feel just as accountable for their safety performance as you do, you’ll have done as much as possible to manage the accountability dilemma. We know that can be a tall order. But it doesn’t mean it’s not worth the effort. What other choice do you have?

The Risk Dilemma

“If there’s a 50-50 chance that something can go wrong, then nine times out of 10 it will.”

—Paul Harvey

What makes for a good dilemma is for two conditions to be beyond dispute—and totally contradictory. Like a battery, the greater the difference between the poles, the greater the voltage&mdashand the bigger the shock when you make contact.

The risk dilemma, we think, fits this description perfectly, once you understand the dilemma. Unlike the accountability dilemma—which becomes immediately obvious upon becoming responsible for the work of others—the risk dilemma is seldom obvious. But don’t confuse subtlety with intensity; this one is deadly serious.

We recently witnessed the first of the two conditions of the risk dilemma, during an intense conversation among several operating line managers and one of our favorite safety staffers. At issue was a particular step in the manufacturing operation that was causing the linemen misgivings: Were something to go awry, a very serious injury was likely. From what we knew about their process, we didn’t think the odds of that happening were small. But the fix was expensive, requiring an investment of capital and time. The right answer was neither easy nor obvious.

The safety staffer eventually said, “You’ve simply got to manage the risk.” Naturally, we all nodded in agreement. It made perfect sense. After all, isn’t safety all about the management of risk?

Risk: Hazard Times Probability
We’ll admit right up front that our view of risk comes from the ranks of the line organization—and real life. Much of what we know about risk was learned out on the golf course. Trying to carry 200 yards of water on a dogleg right is very risky: A big slice and a high score are pretty much guaranteed.

Later on in life, we learned the concepts of hazard and risk as part of the post-Bhopal community outreach effort in the chemical industry. Yes, living in the shadow of a chemical plant posed some potential danger, but technology and good management rendered the probability of the bad event small.

There were more pressing dangers coming from other hazards, like driving, diet and exercise. And, what about the risk of getting hurt on the job? Every human endeavor creates risk: Managing safety requires managing risk. The process is figure out what might go wrong, determine the odds of that happening, and assess the potential damage should it occur. Then, compare that with what you are prepared to live with and prepared to spend. Risk Management 101.

It all makes perfect sense. The odds of failure are never zero; no sense pretending otherwise. Besides, the world of “zero risk”—even if it were attainable—would be unaffordable. We’d go out of business driving all risk down to zero. Everybody knows that. So, where’s the dilemma?

The Rest of the Story

Let’s start by turning the tables. Suppose it’s your family living across the street from our plant. We explain the risk—hazard times probability—of what might go wrong. You listen carefully, then say, “Let me get this straight, you’re telling me that there is some chance that me and my family might just get killed in our sleep?”

“That’s right. But it probably won’t happen.”

Essentially we apply the same logic to those who work for us. We determine the hazards and calculate the probabilities of getting hurt. Most of the time it stops at that point. But, picture having the same conversation as the one we had with our neighbors. The employee listens carefully, then says, “Let me get this straight, you’re telling me, when I’m doing this job, it’s an acceptable risk for you? Maybe you ought to come out here and do this job yourself.”

Unlike the shared risk from a chemical release to the community, the risk of injury is fully borne by the employee doing the work. As the manager, we don’t share the risk, at least not in the physical sense.

Let’s put this to one final test of fairness. Would we be willing and happy to have our own kids working on the “fatal risk” job for which we’ve determined the risk to be acceptable? Now you’re starting to see this dilemma emerging from the shadows.

Thought of in the abstract, risk is a simple and manageable concept. Start personalizing the consequences, and risk takes on an entirely different appearance. Yes, there are always risks. There have to be—risk comes with human endeavor. Yet, we don’t want to live with the consequences when the roll of the dice comes up snake eyes.

When we tell people that all injuries are preventable, and our goal is a workplace free from injury, we really mean that. No manager we’ve ever met would say after a life-altering injury: “Sometimes stuff happens. As long as it doesn’t happen too often, I’m OK with that.”

Now what? If we didn’t answer the questions differently—”yes” to managing risks and “no” to accepting consequences, there wouldn’t be a dilemma. Which one do you want to give in on: elimination of all risks, or living with the consequences of the occasional failure? How about neither?

Here are three ideas:

  • Recognize the dilemma. Naming the beast is the first step in taming the beast.
  • Avoid being trapped by absolutes. Instead of trying to manage “all risk,” go after removing the “next risk,” and don’t stop there. It’s process known as continuous improvement.
  • Think better about the problems. Turn loose the creative juices. Get more people involved in the solution process. There are always better ideas; we just don’t always come up with them, at least not before somebody gets hurt.

Knowing the ambient temperature, wind speed and relative humidity will help you select the proper insulation thickness.

For many years industrial insulation designers worked for companies that had several manufacturing locations throughout one region of North America. However, things have changed in the 21st century. Growth in the chemical process industry is increasingly moving offshore to China, India and other Asian locations. While roughly 25 percent of the world’s chemical production is still located in North America, that number will fall dramatically in the next 20 years. How will this change affect insulation design? It will have an impact on everything from material availability to the way insulation thickness is calculated. Let’s take a look at how environmental variables have an impact on the design of insulation systems.

We must first define environmental variables. With respect to insulation thickness calculation, there is ambient temperature, wind speed and relative humidity to consider. Ambient temperature is important because it has an influence on heat transfer,
and therefore affects the insulation thickness required. Humidity has an influence on the design of low-temperature systems because it controls the dew point temperature. Wind speed is important in both low- and elevated-temperature systems because it controls convective heat transfer and, again, will influence the required insulation thickness. We can use the computer program 3E Plus© to evaluate easily how these variables impact insulation thickness.

First, let’s consider the impact of ambient temperature on insulation thickness. In this sensitivity analysis, we will calculate how changing ambient temperature affects the personnel protection (PP) temperature of a system while all the other variables are held constant. The PP temperature is the maximum surface temperature allowed for insulation jacket that can be easily touched by personnel working in the area. This temperature is often 140 F. We will assume a process temperature of 350 F, an average ambient wind speed of 10 mph and will calculate the PP thickness for ambient temperatures ranging from 10 F to 100 F. The insulation jacket material is oxidized aluminum; the insulation material is mineral fiber, and the insulated substrate is a 4-inch diameter pipe of 300 series austenitic stainless steel.

The mineral fiber thickness required to achieve a PP temperature of 140 F on this 4-inch pipe is 0.5 inches, regardless of the ambient temperature up to a maximum ambient of 104 F. In this case, whether the plant is built in Siberia (really cold) or Singapore (hot, average year-round ambient high temperature of about 85 F), the PP thickness would be just 0.5 inches.

What about changing the size of the pipe? If we increase the diameter of the pipe to 8 inches, the maximum ambient temperature that still allows 0.5-inch thickness drops from 104 F to 88 F. Now location does matter; the Siberians would still be safe, but in Singapore it would be a good idea to increase the thickness to 1 inch.

This analysis shows that for similarly sized equipment, the range of average ambient high temperature found around the world probably won’t have much of an impact on insulation thickness. There are extremes: For instance, desert environments where average highs may be above 100 F would likely be different than more temperate locations. But overall, most locations where chemical plants are likely to be built (with the exception of Saudi Arabia) will require insulation of similar thickness when equipment size is ignored. Interestingly, in this example, moving to very cold locations has little impact on the insulation thickness required. Even at 10 F we must still use 0.5 inches of insulation—the lowest thickness available in 3E Plus—to obtain a safe surface temperature.

Next, let’s consider the impact of wind speed on insulation thickness. Wind speed controls convective heat transfer and is important regardless of whether we are looking at an elevated temperature system or a cold system. In this example, we will use the same operating conditions as our earlier example and will set the ambient temperature at 75 F.

In our first example, the PP thickness was 0.5 inches when the wind speed was 10 mph. With the wind speed at 0 mph, the PP thickness jumps up to 1.5 inches. At a thickness of 0.5 inches, as determined in the first example, the surface temperature is 189 F, well above the PP cutoff of 140 F and 77 F above the temperature when the wind is blowing at 10 mph. Using a wind speed of just 1 mph drops the PP thickness to 1 inch and lowers the surface temperature at the 0.5-inch thickness to 169 F. So, just a little movement of air past the insulated surface can result in a useful reduction in surface temperature. At 3 mph the PP thickness is back to 0.5 inches.

Clearly wind speed has a significant effect on surface temperature and must be considered when designing for personnel protection. What about efficiency? As you might expect, when the wind is not blowing, there is no convective cooling and the system does not lose as much heat. At 0 mph the heat loss at 0.5 inches is 157 Btu/hr/ft while it rises to 194 Btu/hr/ft at 3 mph. Again, just a little wind has a significant impact on heat loss. It is obviously important to understand what sort of air movement will exist around the asset that is to be insulated. Indoor locations may require more insulation for personnel protection but less insulation to achieve the desired efficiency target. It is also important to understand why insulation is being used in each case.

Finally, let’s consider the effect of relative humidity on insulation thickness. This variable becomes important in the design of low-temperature systems because it has an impact on the dew point temperature and the condensation control (CC) thickness. The CC thickness is the thickness required to raise the insulation jacket surface temperature above the dew point, thereby preventing condensation. In this example we will again use a 4-inch stainless steel pipe, but we will change the operating temperature to -50 F. The ambient temperature is 75 F; the wind speed is 3 mph, and the material is ASTM C591-00 polyisocyanurate closed-cell rigid insulation. With the relative humidity at 10 percent, the dew point is a low 14.8 F and the CC thickness is just 0.5 inches, yielding a surface temperature of 58 F, well above the dew point temperature. Raising the wind speed to 10 mph raises the surface temperature even more; so wind is helpful with respect to condensation control.

But, what does wind do for heat gain? In this case, not much: It increases about 4 Btu/hr/ft due to convective heating of the jacket surface. Raising the humidity to 50 percent raises the dew point to 55 F but does not change the surface temperature; so 0.5 inches still works as a CC thickness. When the humidity reaches 55 percent, the dew point and surface temperature converge at 58 F, and the thickness must be increased to prevent condensation. With this insulation material, increasing the thickness to 1 inch raises the surface temperature to 66 F, well above the dew point. Raising the humidity to 85 percent raises the dew point to 70 F, and the CC thickness goes to 2.5 inches! If your low-temperature system is installed in locations with high relative humidity, the condensation control thickness will be significantly higher than it would be in the desert.

These very simple analyses demonstrate that the environment in which a system operates plays an important role in system design. Using a specification from last month’s project in Saudi Arabia probably won’t work for this month’s project in Chicago. It is important to make the effort on each project to define the environment and use that information to properly size the insulation. It is also important to understand why insulation is being installed. Personnel protection may require a very different thickness than simply designing for an energy-efficiency target. The materials selected obviously also make a difference. This sounds like a good topic for a future column.

Generally, the principles of condensation control are very straightforward, but let’s consider the consequences of an

insulation system failure in a condensation control application. Insulation, including accessory products such as adhesives,

mastics, caulks, pipe-hanger supports, jackets and coatings, should all be considered as a system. Consideration of the

consequences of a failure should drive the initial design and installation of the system.

The principles of preventing condensation are very simple: Maintain the surface temperature of the insulation above the dew

point, and prevent any intrusion of moisture or moist air into the insulation system (particularly between the insulation and

the pipe being insulated).

These principles are accomplished through proper insulation design (the correct selection of type and thickness),

installation and maintenance. As a matter of fact, maintenance of an insulation system can be greatly reduced if the design

accounts for the environmental conditions that the insulation will encounter. Proper completion of the above steps will

ensure a successful project.

Pipe size, ambient temperature, pipe temperature, wind speed, emissivity of insulation or jacket, location of application,

and most importantly, the relative humidity, must also be considered for a proper design.

Most project specifications will state that the insulation should be installed according to the manufacturer’s

recommendations. Some basic installation guidelines are often given as well. However, if the design engineer fails to

consider the level of difficulty for properly installing an insulation system, particularly under the labor, site and climate

conditions in which the insulation system will be installed—this can play a major role in the failure of the insulation

system. Labor experience, severe weather conditions, logistics and project timetables all must be considered in the

installation step. Failures during installation always result in finger-pointing, but can often be avoided if potential

installation problems are considered in the initial plan.

Periodic maintenance of the insulation system is critical for preventing premature failure of the system and for reaching the

life expectancy of the system. When you consider the lifespan of the insulation system, it is often less expensive to build

more reliability into the insulation system in the beginning than it is to rely on excessive maintenance afterward. This is

especially true for installations in which the required maintenance may not get done, resulting in a premature and costly

system failure.

If the insulation system is designed and installed properly, the worst failure scenario would be condensation formation on

the outside of the insulation in those extreme cases when the actual dew point exceeds the dew point limit of the design. If

the insulation is properly designed and prevents water intrusion, moisture on the insulation surface generally will not

result in a catastrophic failure of the system: It either will be a short-term problem or will be correctable by adding

insulation thickness.

Unfortunately, however, most condensation control application failures do result in catastrophic or complete insulation

system failures. Unlike insulation on hot systems where a failure may only result in excessive loss of energy, failures in

below-ambient systems can have major consequences and are usually easily detected. Even in concealed spaces, the consequences

of condensation control failures usually show evidence quickly, resulting in costly repairs.

Failures are often caused by the inadequate performance of special areas that are difficult to insulate, such as pipe hangers

and valves. Another potential cause of failure is when work needs to be done by another tradesman (i.e., an electrician) and

in the process of doing his work he damages the insulation. The insulation then needs to be replaced.

In some instances, design flaws can result in failures, such as not leaving adequate clearance for insulation to be

installed, or failing to specify the adequate insulation for items such as valve stems/handles. Condensation control

applications require all areas be insulated and sealed properly. The insulation system is only as good as its weakest link.

The typical consequence of condensation control failures is saturated insulation—particularly if the insulation is not

closed-cell or if the jacket protecting an open-cell product has failed. Moisture will contribute to the following

conditions:

  1. Loss of insulation value: One percent weight gain due to moisture results in 7.5 percent loss in thermal efficiency.

    Reduction in insulation value can contribute to further insulation failure, quickly resulting in a total failure of the

    system.

  2. Increased insulation weight: This can cause it to deform and possibly fall from the pipe.
  3. Potential corrosion of pipes.
  4. Mold and mildew on the insulated surface itself as well as surrounding areas: ceiling tiles, carpets, throughout the

    insulation and under jacketing—especially in open-cell insulation. Mold and mildew could potentially affect the entire

    building if they get in the air stream.

  5. Loss of energy and higher operating cost.
  6. Unsafe conditions: Water dripping and accumulating in ceiling tiles or on floors, possibly even forming ice, can

    create slip hazards to the personnel below. Condensation falling onto electrical equipment can cause shock hazards and can

    damage sensitive equipment.

  7. Condensate dripping can also contaminate the product being produced below the piping system.
  8. Unpleasing aesthetics, such as water-stained ceiling tiles, walls and carpets, as well as deformed and discolored

    insulation.

The costs associated with remediation of the above consequences can be very expensive and generally far exceed the cost of

the insulation system. Repairs to the system, especially if the pipes are in concealed spaces of occupied areas, are several

times the cost of the insulation system. If a production facility has to be shut down for any length of time to make repairs,

the cost of lost production can mount up. Product quality may suffer if manufacturing processes are not kept at the correct

temperature, and overall plant efficiency may suffer as well. If the problem exists in a plenum or duct area, indoor air

quality will suffer, causing worker discontent and possible lost time on the job. In many cases, the above costs are brought

out in lawsuits, which can significantly increase the costs associated with the problem.

Moisture intrusion between the insulation and pipes caused by seam failure or saturated insulation can result in the need to

replace the piping. This will result in shutting down the facility to make the repairs. The cost to shut down a facility

multiplies the cost factor.

Some installation techniques that can be used to reduce the chances of a failure or lessen the costs associated with a

failure are:

  1. Prefabricate as much of the insulation as possible under ideal conditions prior to taking it to the job site, either

    at the manufacturer’s site or in the contractor’s shop.

  2. Adhere the insulation to the pipe every 20 feet, creating a water dam—this contains moisture from a failed area and

    prevents its travel to other areas of the system.

  3. Use systems with additional margins of safety, such as closed-cell insulation under a waterproof jacket or mastic.
  4. Use robust jacketing systems outdoors because they are designed for years of service and low maintenance.
  5. Use jacketing systems that adhere to the insulation in order to prevent moisture travel between the insulation and the

    jacket.

  6. Use adequate insulation thickness based on the design dew point. It is better to err toward “too thick” as the added cost

    of the insulation will be a small part of the total cost of the installed system, and will cost much less than if the system

    fails.

  7. Insulate all areas of the system: Remember that the system is only as good as its weakest link. Using accessories

    such as pre-insulated pipe hangers is a good idea—they save time and ensure proper insulation thickness.

Mold and mildew are the new key buzzwords in regards to liability. Insulation systems that limit moisture absorption or have

secondary layers of defense against moisture intrusion will greatly reduce liability for mold and mildew problems. Designers

of schools, hospitals, hotels and public buildings are looking for solutions to the mold/mildew issue. Preventing moisture in

the system will eliminate the issue. Selecting the proper materials, maintaining the material’s integrity at the job site and

correct installation are all key to prevention.

Generally, catastrophic failures can be traced back to seam failures (caused by improper installation) or failure of the

jacketing that protects open-cell insulation, both of which can be minimized in the design stage of the project. Insulation

systems that are easier to install should be a clear choice. Jacketing systems that have safety factors built in should also

be a clear choice. The initial cost of ensuring proper installation can be easily justified when one considers the future job

site labor savings and the increased reliability of the system.

Installing a system that you know will require a great deal of maintenance is a failure in the making. You must consider the

conditions in which the insulation will function when designing a system. For indoor applications, jacketing on the

insulation may or may not be needed, depending on the insulation selected and the expected use. For example, applications

that will experience mechanical abuse or wash-downs should be jacketed. Outdoor applications (e.g., rooftop applications)

will always need to be protected, not only from UV rays but also from other environmental factors. Outdoor applications with

extreme conditions (e.g., coastal or offshore applications) will require more robust jacketing. In many cases, adhesives,

mechanical fasteners and silicone sealants will be required to keep the insulation system moisture-proof. It should be

expected that people will walk on, lean ladders against and generally abuse the insulation system. A sign directing personnel

not to walk on the insulation is not adequate. Jacketing should be selected to be robust and, in the case of damage, easy to

repair.

The reliability of the insulation system should be of key concern in the design phase. As stated above, the primary reason

insulation systems fail is because they are improperly installed. Many design engineers have never seen insulation installed

and underestimate how difficult it is to provide a correct installation. It is the responsibility of the insulation

manufacturer, distributor and contractor to advise the design engineer of systems that are easier to install and are more

reliable in the field, even if the initial costs are higher. Standing behind the old adage, “I gave him what he asked for,”

will not benefit our insulation industry, nor will it build the positive relationship that is needed between the design

engineer and the insulation industry. We should not aim to be considered a manufacturer, distributor or a contractor, but to

be a highly specialized consultant to the design engineer.

The cost of a good insulation system can be easily calculated. The cost of the payback in terms of energy savings can also be

easily calculated. The cost of an insulation system failure can be priceless. Effective condensation control is not a matter

of chance, compromise or cost minimization: From the beginning of a project, it requires communication among all parties

involved—the engineer, the insulation contractor, the manufacturer of the insulation and accessory materials, and the

facility owner.

  
Click Photo to Enlarge

Figure 1

Figure 1

The consequences of condensation failures include mold and mildew, which can potentially

affect the entire building if they get in the air stream.

Figure 2

Figure 2

Figure 3

Figure 3

Figure 4

Figure 4

Condensation control is particularly important in below-ambient applications such as chilled water piping.

Figure 5

Figure 5

In below-ambient applications, condensation failure can cause unsafe conditions such as the ice on these

pipes.