Look at the cost of energy today. According to the Department of Energy’s "Short Term Energy Outlook – January 2004" (http://www.eia.doe.gov/emeu/steo/pub/contents.html) home heating costs for the 2003-2004 winter period are forecasted to go up in all areas except home heating oil. Adding further bad news, it is forcasted to continue to go up for the foreseeable future. Figure 1 shows the cost of energy from 1991 through the forecasted 2005 costs for crude oil and natural gas.
Now, if you consider 1970, a time period in which many industrial and commercial facilities were built, the energy picture looks even more interesting. Costs for crude oil and natural gas were $2.96 per barrel and $0.17 per MCF, respectively. The projected 2005 costs now represent a cost increase of 761 percent for crude oil and 2,829 percent for natural gas.
Given these facts, it is not surprising that industry has started to take a much greater interest in improving the energy efficiency of their facilities. After all, saving cost through improved energy management would help keep a business competitive in this ever more globally competitive world. Plants and refineries have started to look at improving their boiler, heater and furnace efficiencies. They have tackled process control improvements, maintenance improvements such as improved heat exchanger cleaning and, in some cases, looked at whole new methods and facilities to manufacture their product. Look at the oil refining industry, for example. The oil industry’s benchmark for energy performance is the Solomon Energy Intensity Index (EII). A refinery with a poor EII is not likely to be considered a good performer, and this impression may likely follow down to that refinery’s management.
Although it is likely that industry will need additional time and effort to fully implement their new, improved energy management programs, it seems like they are well on their way doesn’t it? Well, not quite. In many companies’ energy improvement plans, an important element is missing: insulation assessment and upgrade projects.
How important is insulation energy assessment? How large is the stake? What’s the opportunity? Let’s find out.
The Stake and Opportunity
Previous articles have mentioned these but they probably remain the best example. Look at a typical mid-sized chemical plant and oil refinery of 125,000 barrels per day (BD). Figure 2 shows clearly what the amount of opportunity is.
Considering there are more than 200 refineries and far, far more chemical manufacturing plants, that amounts to billions of dollars available to be saved.
However, the potential energy improvement opportunity does not stop there. Remember the low energy costs for crude oil and natural gas mentioned above for the year 1970 and the fact that many of the U.S. chemical manufacturing and oil refining facilities were constructed around this time? Insulation selection and design often consider the cost of energy as one of the important factors determining the insulation thickness needed for effective performance. Figure 3 shows the difference in insulation thickness for the same 4" pipe example using 1970 actual and 2005 projected natural gas energy costs.
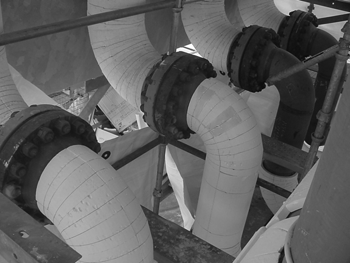
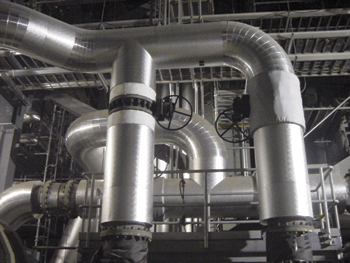
Clearly the example shown in Figure 3 suggests there may be a much larger potential savings for industry by considering insulation thickness upgrade opportunities even for those insulation systems that are physically intact. Using the same 4" pipe example from Figure 3, the energy saved by upgrading its insulation thickness from 1" to 3" is over 717,000 Btu and $4.64 per year for just 1 linear foot! Now, look at that typical chemical plant or oil refinery again! Those 61 miles and 356 miles of insulated piping respectively look like an even larger opportunity for energy cost improvement than you first thought. Clearly not all of these existing insulated piping systems are good opportunities for insulation upgrade opportunities for many reasons:
- They are newly installed with current upgraded insulation systems;
- They have been upgraded in the recent past; or
- Physical space limitation may restrict insulation system upgrades.
However, this makes a strong case for assessing your insulation systems to see where those insulation systems upgrade opportunities exist.
Energy Is Not the Only Gain
Do you need additional convincing? Insulation assessments and their resulting upgrade or repair projects can have an impressive effect in reducing various environmental emissions. It is likely you are skeptical how much, if any, insulation assessments and their improvements can have on environmental emissions. Well, let’s look at it.
Emissions Improvement
Nearly all sources for today’s energy (excluding nuclear, geothermal, wind and hydroelectric electrical generation systems) come from fossil fuels in one form or another and the combustion of those fossil fuels to get at that energy source. This results in the release of carbon dioxide (CO2), a "greenhouse gas," various compounds of nitrogen and oxygen (NOX), an atmospheric pollutant, plus carbon monoxide (CO), sulfur compounds and others. So how does upgrading or repairing damaged insulation systems have much, if any, affect on the amount of environmental emissions? As mentioned above, performing an insulation energy assessment, and then acting on it to repair or upgrade insulation systems, saves significant amounts of energy As a result less fossil fuel needs to be burned in order to create the energy and less CO2 and NOX emissions are produced. Figure 4 shows just how much CO2 and NOX is saved for several common pipe sizes operating at 400°F, a common operating temperature for both chemical plants and oil refineries.
Emission savings look as impressive as energy cost savings. Looking at only CO2 savings for the smallest example, the 4" pipe, there are savings of over 1.5 tons of CO2 per year for only 1 ft of bare pipe. Once again when we look at the amount of insulated piping, vessels and equipment that exists and how much is damaged or may be underinsulated by today’s cost of energy, there is a big opportunity to reduce emissions.
Process and Safety Improvement
Performing an insulation assessment and subsequently improving the insulation system, especially damaged insulation, makes those systems much less susceptible to water infiltration and ambient temperature swings. As a result, process piping, vessels and equipment operate with much more stable temperatures, making process control a simpler task and reduces the possibility of plugging or freeze-up almost to zero. Keeping water out of the insulation system also reduces the risk of corrosion under the insulation, therefore increasing reliability and minimizing catastrophic failure of, and its resultant risk to, personnel and the environment.
The Insulation Energy Appraisal
A facility owner has two ways to perform insulation energy appraisals, the use of insulation energy assessment professionals or the use of your own personnel. If you opt to perform this type of assessment with outside resources, the National Insulation Association (NIA) is a source for finding a certified professional. If you choose to perform this work with facility personnel, NIA also offers a training program, the Insulation Energy Appraisal Program, to train your personnel to perform this assessment.
Personnel performing insulation energy appraisals will only be effective when the appraiser obtains a full and complete understanding of the operations involved on the site. This requires a good working relationship established with personnel that typically includes the plant manager, energy manager, maintenance engineer and operations superintendent. This is true whether you are an employee performing this assessment for your own company facility or are an outside energy appraisal professional. Mutual trust is vital, and confidentiality agreements should be proposed to assure that any revealed proprietary information be protected and remain confidential.
Simply stated, system energy losses to (or from) the atmosphere (indoors or outdoors) are directly proportional to:
- The temperature difference between the materials in the operating system and the ambient air;
- The surface area of the containment such as a pipe, duct, vessel, or equipment in the system;
- The characteristics of the insulation system expressed in a term called the overall heat transfer coefficient (U factor); and
- The annual hours of operation and the efficiency of that area’s energy source.
An initial visit is often solely for gathering this type of general site information. Items such as process and instrument drawings (P&ID), insulation specifications and safety and security requirements can be requested at this time. General design parameters for ambient air temperature, wind velocity, relative humidity, fuel type, fuel heat content, conversion efficiency and annual hours of operation should also be requested. All of this information is essential to calculating energy savings for the insulation energy assessment. When received, they should be duly entered in the appraisal worksheets.
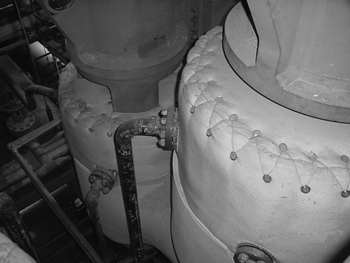
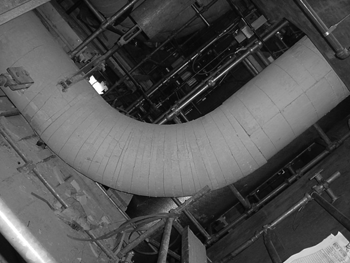
Subsequent plant visits are then for the purpose of gathering data and assessing the individual components. The appraiser must measure and document specific data for each component, such as pipe, vessel and equipment diameters and lengths, operating temperatures, insulation system thickness and materials of construction. Tools for these measurements include a tape measure, penetration depth gauge and infrared thermometer. Pipe calipers and a measuring wheel are also useful, making pipe diameter and length measurements easier. Infrared thermography is also quite effective in obtaining visual images of the system heat losses that highlight problem areas to the owner. They assist in identifying energy losses that might otherwise not be apparent by other visual assessment methods. The photos above show piping that does not show very much damage at first glance, but look very different under IR imagery. A digital camera is also helpful and is recommended to show the present condition of a system component and to aid in locating the specific component once it comes time to show the work to an insulation contractor. Rounding out the tools list, add a clipboard, pencils, chalkboard and marker for item identification in photographs, and the field survey forms on which to enter all the measurements. This is a lot of gear, and some sites are quite large and complex, so if you do not have access to vehicle transportation on the site, it will be helpful to use a backpack to carry the tools.
The final step in the preparation for the walk-through is to prepare the plan of attack. There are two ways you can assess a facility, geographic or system assessments. A geographic approach develops project packages for all work within certain geographic sections of the facility, such as a production unit, run of pipe rack, etc. This allows a facility, owner to make maximum use of the cost associated with access and setup. Often this is no small consideration as it can be 10 percent or more of the total job cost. With a geographic approach, each area assessed should be done in the same, organized way. For example, if you assess the first section working from west to east and then working your way from north to south, do this for each area you assess. This method allows each project work scope to be easily shown again to the facility owner or the insulation contractor that will be performing the work.
A systematic approach is an assessment of a particular insulated system within the facility, from start to finish (e.g., the 150 lb. steam distribution system from the boiler house to the end of the pipe run). This method allows maximum system efficiency improvement and allows you to focus exclusively on those maximum energy saving systems.
Both geographic and system methods have their advantages; so select the method that provides the best assurance that each and every component of the process is observed and fits the facility’s needs best. Deciding on the best plan of attack for the assessment at this stage provides the foundation for an effective assessment and its resulting work packages.
Confirm your appointment with your contact, and be at the site on time fully prepared to find those items where the insulation systems are not performing as intended. The appraiser must remember he is a visitor subject to the security and safety regulations of the owner. Remember, you can not help anyone if you are not welcome at the facility.
So what does one look for? From the statistical viewpoint, there are more installations where fluids are being handled at temperatures above ambient than below. Systems that are outdoors are exposed to the elements and present high potential for insulation system water damage and deterioration and often the greatest opportunity for maximum energy savings.
Look for insulated system components with bare surfaces exposed to the ambient air. Most people are amazed to learn that heat losses are about 20 times higher for bare surfaces than for insulated surfaces regardless of the insulation type and thickness. Measure the temperature of this surface; determine its surface area and orientation, give it a unique description number; photograph it; take a thermographic image if available, and enter the measured values on the field survey form along with the insulation type and thickness in adjacent sections. If it is a piping run, we must measure the diameter of the pipe, measure the length of uninsulated pipe, and enumerate the number and descriptions of uninsulated fittings such as elbows, tees and valves. Sometimes there may be a reason to leave a hot surface uninsulated where energy losses or personnel protection considerations are secondary in importance to the owner. The appraisal will help put a monetary value on the cost of such a decision.
Look for insulated system components where the exterior surfacing treatment is damaged, penetrated, missing or lacking the seals at seams and joints that provide paths for water migration underneath the weather barrier. In the case of fluids at low temperature, this surfacing is also to provide vapor retarder protection. Measure the temperature of this surface; determine its surface area and orientation; give it a unique description number; photograph it; take a thermographic image if available, and enter the measured values on the field survey form along with the insulation type and thickness in adjacent sections. A safe assumption for systems located outdoors is that if the weather barrier is damaged, the insulation system is wet. Therefore thermal performance is degraded, and the possibility of metal corrosion problems is greatly enhanced.
Once the data is collected in the field, it is time to use the 3E Plus® Computer program. The 3E Plus® computer program is provided by the North American Insulation Manufacturers Association (NAIMA) and is available for direct download from their website (www.pipeinsulation.org). A comprehensive spreadsheet program is also available from NIA if you have taken advantage of their energy appraisal training program.
These programs are used to determine the energy savings, in Btus and dollars, available for each component of the insulation energy assessment, the best economic insulation thickness for each system and the improvement in environmental emissions resulting from the insulation upgrades.
A Success Story
Sunoco, an oil company with two large refineries located in the Philadelphia, Pa., area, is an insulation energy assessment success story. The oldest of the two refineries was started up in the early 1900s, with the other refinery being a bit newer but still constructed much earlier than the 1970s. Probably for this and several other good reasons, Sunoco is a corporation that has taken an active, aggressive interest in energy management and improvement for several years. They pay close attention to their Solomon EII and continue to look for ways to improve it, recognizing that it is far more profitable to sell energy than consume it. When asked why Sunoco takes such an active interest in energy improvement, Mike Sanders, corporate energy manager, had a very straightforward answer. "It’s (energy cost) 55 percent of the OP(erating) EX(pense) for the refineries!" For Sunoco, looking at energy improvement wasn’t strictly limited to the large energy consumers like boilers, heaters and furnaces. They also attacked process control, aggressive heat exchanger cleaning programs to improve the exchanger heat transfer efficiency and, a few years ago, insulation upgrade projects. Sanders and his management came to realize that insulation energy assessments and their resultant insulation upgrade projects would also yield significant returns on the money spent. In 2003 alone, Sunoco authorized several insulation upgrade projects that have projected return on investments (ROI) from well over 100 percent to well over 300 percent, savings Sunoco millions of dollars as early as 2004.
However, a little surprising to Sunoco, improvements to their insulation systems did not stop at energy cost improvement. When Sanders was doing some post-project follow-up in one of their crude oil units, talks with the unit operating personnel yielded some interesting results. Between the insulation upgrade project and the heat exchanger cleaning program that was completed about the same time, the operators started to notice process operating improvements. Operating temperatures no longer fluctuated as much, making process control better, improving the unit’s performance. Although it’s too early to determine how much savings this will offer Sunoco, typically process performance improvements result in much greater cost improvements than even the energy cost savings. As an additional plus, operating personnel also said they felt running the unit was now easier.
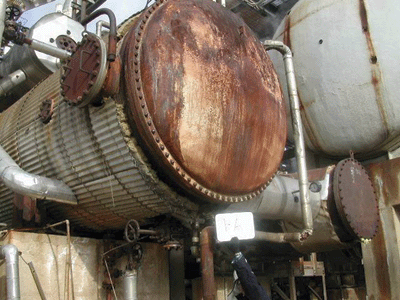 Figure 1
Damaged Equipment
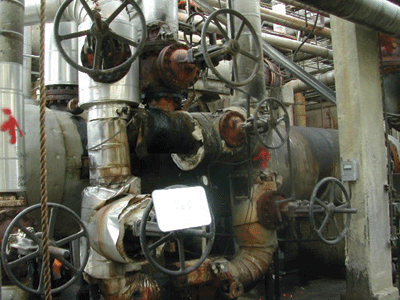 Figure 2
Damaged Piping
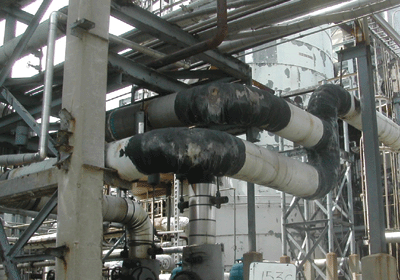 Figure 3
Corrosion under Insulation
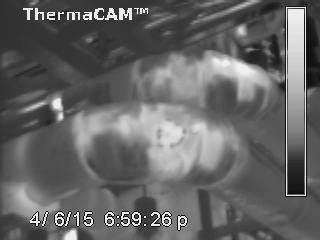 Figure 4
IR Image of Piping
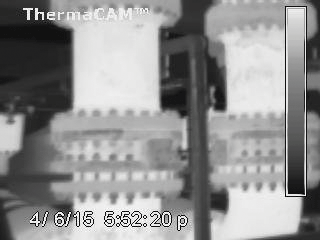 Figure 5
IR Piping Image
 Figure 6
System Assessment Approach