Category Archives: Global

Introduction

Plastic piping for domestic hot and cold service water systems, and for HVAC systems in buildings, has been in use for many years and has become the dominant piping material for residential construction. One source1 estimates that plastic pipe systems are currently used in 75% of the potable piping systems in new residential construction, and this number is predicted to rise to 80% by 2015. Plastic piping is also used routinely in commercial and industrial applications.

Compared to metallic piping systems, plastic piping materials have a significantly lower thermal conductivity, which translates to lower heat transfer between the fluid and the ambient air. For some piping applications, this can be advantageous. For example, city water lines entering a building will often sweat due to the relatively cold temperature of the water entering the building. Depending on the ambient conditions, plastic piping may minimize or eliminate the surface condensation and associated dripping from cold water pipes. However, when insulation is required by energy codes, the impact of the pipe wall material on the overall heat transfer is generally small. For this reason, energy codes do not differentiate insulation requirements based on pipe wall material.

How much insulation is needed on plastic pipe? As is often the case, the answer depends primarily on the design objectives. There are a number of reasons to insulate piping. The Mechanical Insulation Design Guide lists seven design objectives: Condensation Control, Energy Conservation, Fire Safety, Freeze Protection, Personnel Protection, Process Control, and Noise Control.2

Often, designers are faced with multiple design objectives (e.g., energy conservation and fire safety). The amount of insulation required depends on the design objectives and the specifics of the application. In some cases (e.g., condensation control or freeze protection) plastic piping may need no insulation. In other situations, additional insulation may be required, relative to metallic piping. Requirements need to be determined on a case-by-case basis by analyzing the expected operating conditions. Significantly, when the objective is energy conservation (i.e., compliance with energy codes and standards), plastic piping generally requires the same amount of insulation as metallic pipe.

Plastic Piping Materials

A number of different plastic materials are used in piping systems, including:

  • ABS (Acrylonitrile Butadiene Styrene)

  • CPVC (Chlorinated Polyvinyl Chloride)

  • PB (Polybutylene)

  • PE (Polyethylene)

  • PEX (Cross-linked Polyethylene)

  • PP (Polypropylene)

  • PVC (Polyvinyl Chloride)

  • PVDF (Polyvinylidene Fluoride)

These plastics have various properties that make them more or less appropriate for various applications. A key property for hot systems is maintaining strength at high temperatures. Since all plastics lose strength as temperature increases, the use of plastic piping is limited to operating temperatures less than 220°F. For domestic hot and cold water piping systems, CPVC and PEX are the most common materials. For chilled water distribution piping, many different materials may be used. 

When it comes to limiting the transfer of heat, the key factors are thermal conductivity and the wall thicknesses of pipe products. As expected, the thermal conductivity of plastic pipe materials varies. Table 1 is extracted from various sources and shows the range of conductivity values reported in the literature. Values range from a low of 0.8 Btu?in./(h?ft.2?°F) for PVDF to a high of 3.2 Btu?in./(h?ft.2?°F) for PEX. For comparison purposes, the conductivity of copper is approximately 2,720 Btu?in./(h?ft.2?°F) at a temperature of 75°F; while steel has a conductivity of approximately 314 Btu?in./(h?ft.2?°F).

Plastic piping is manufactured to a number of different size standards. CPVC is available in either nominal pipe sizes (NPS) from ¼” to 12″ or in copper tube sizes (CTS) from ¼” to 2″. NPS sizes are available in either Schedule 40 or Schedule 80 wall thicknesses. CTS sizes for wall thickness have a standard dimension ratio (SDR) of 11 (i.e., the outside diameter is 11 times the wall thickness).3

PEX is available in CTS sizes from ¼” to 3″ with SDRs of approximately 9. Dimensions used in this study were taken from the National Association of Home Builders (NAHB) Research Design Guide “Residential PEX Water Supply Plumbing Systems.”4

Heat Transfer Calculations

The data from Table 1 demonstrates that the thermal conductivity of metallic piping is 30 to 3,000 times higher than typical plastic piping materials. However, the impact on heat transfer to or from the fluid will depend not only on the relative thermal resistances of the pipe wall, but also on the other thermal resistances in the system. For bare piping, the air surface coefficient normally represents the largest thermal resistance in the system. The wind speeds at the surface, along with the thermal emittance of the surface material, are dominant. As insulation is added to the system, the resistance of the insulation layer begins to dominate and other resistances become less important. Figure 1 compares the heat loss from a horizontal 2″ tube containing water at 140°F in still air at 75°F. For the bare case, the heat loss from the CPVC tubing is significantly less than the copper tubing. At insulation thicknesses above ½”, the difference in the heat loss becomes small. Flexible elastomeric insulation was assumed for this example.

The relative magnitude of these effects will vary according to the situation, but they can be estimated using well-established calculation procedures. The procedures for these calculations are outlined in ASTM Standard C 6805 and in many heat transfer textbooks. 

A few example applications were selected to help illustrate the relationships. All of these examples compare thin-walled (Type M) copper tubing to standard-size CPVC and PEX tubing. These materials were chosen because, together, they represent the largest share of products in the marketplace and because they effectively span the range of thermal conductivities for piping. Table 2 shows the conductivities and surface emittance used in this analysis.

Example 1 assumes a 2″ CTS domestic hot water (DHW) line located within a commercial building. The operating temperature of this line is 140°F and the ambient conditions are assumed to be 75°F with 0 mph wind speed. For calculation purposes, the insulation material is flexible elastomeric insulation (ASTM C 534 Grade 1). The 2012 International
Energy Conservation Code (2012 IECC) Energy Code requirement for this application calls for 1″ of insulation. Calculated heat losses per foot of piping run are summarized in Table 3.

Example 2 involves a 1″ CTS heating hot water (HHW) line in a commercial building. The line operates at a temperature of 180°F and runs through a return-air plenum with an air temperature of 75°F and an air velocity of 3 mph. For this example, we will use fiberglass insulation (ASTM C 547 Type I). The 2012 IECC insulation requirement for this application is 1 ½.” Results of the calculations are shown in Table 4. 

Example 3 is a 2″ CTS chilled water supply (CWS) line operating in a mechanical room of a commercial building. The operating temperature is 40°F; the ambient temperature is 80°F; and the wind speed is 1 mph. The insulation material is flexible elastomeric insulation
(ASTM C 534 Grade 1). The 2012 IECC insulation thickness requirement for this application is 1″. Results from this example are shown in Table 5.

Results for all three of these examples are similar and reveal the following important points:

  • As expected, the heat loss or gain depends on both the thickness of the insulation as well as the choice of the pipe material. However, the effect of insulation thickness is considerably more significant than the choice of pipe material. In Example 1, adding 3/8″ of insulation to the bare copper line reduces the heat loss by 61%; while changing the “bare pipe” material from copper to CPVC reduces the heat loss by
    21%.

  • For bare piping, the effect of base pipe material on heat flow is significant. The largest effect is for the CPVC cases (as CPVC has the lower thermal conductivity). Compared to the copper case, the CPVC cases show reductions of heat flow of 21%, 34%, and 27% for the three examples, respectively. Reductions for the PEX case have a smaller effect and average an 8% reduction of heat flow. For the still air case, the lower emittance of the copper surface (Ɛ=0.6) contributes some thermal resistance relative to the plastic cases (Ɛ=0.9).

  • The impact of the base material decreases as the amount of insulation increases. In Example 1 with 1 inch of insulation, the heat loss for the CPVC material is 7% less than the comparable copper case. At 2″ of insulation, the difference is below 5%. Considering all three examples, the impact at 2″ of insulation averages 4.4%

  • Based on these examples, trading insulation thickness for lower conductivity pipe material would not work. In Example 1, at the code-required insulation thickness of 1″, the heat loss for the copper pipe system is 12.2 Btuh/ft. The alternate design of CPVC with ¾” of insulation (the next smaller increment for this insulation material) yields a higher heat loss of 12.9 Btuh/ft. Examinations of the other cases yield a
    similar conclusion: Plastic pipe lowers the heat flow, but not enough to
    justify removing an increment of insulation.

Energy Code Requirements for Piping

All of the current model energy codes contain insulation requirements for domestic hot water and HVAC piping. Although the details vary somewhat, the requirements are generally given as a minimum insulation thickness without regard to pipe material. As an example, requirements for service water heating from the 2012 IECC are given in Section C 404.5 and read as follows:

C404.5 Pipe insulation. For automatic-circulating hot water and heat-traced systems, piping shall be insulated with not less than 1 inch (25 mm) of insulation having a

conductivity not exceeding 0.27 Btu ?inch/(h?ft2?°F).

The first 8 feet (2438 mm) of piping in non-hot-water-supply temperature maintenance systems served by equipment without integral heat traps shall be insulated with 0.5 inch (12.7 mm) of material having a conductivity not exceeding 0.27 Btu?in./(h?ft2?°F).


The only qualifier here is that the insulation has a conductivity not exceeding 0.27 Btu?in./(h?ft.2?°F). Insulation thickness requirements are the same whether the base material is copper, schedule 40 steel, schedule 80 stainless steel, CPVC, or PEX. While the choice of base material will impact the heat loss or gain of insulation systems, the effect is relatively small for insulated piping. 

The 2012 IECC requirements for piping for HVAC systems in commercial buildings are summarized in Table 6. The thickness requirements here are differentiated by operating temperature and by nominal pipe or tube size. As before, the thickness requirements are not differentiated by pipe base material or wall thickness. 

Thickness requirements are again independent of the insulation material, as long as the conductivity of the material falls within the specified range. If the conductivity of the insulation layer is outside the specified range, the required insulation thickness must be adjusted based on the equation in Table 6’s footnote b. Note that since the emittance of the outer surface is not addressed in Table 6, the thickness requirements are independent of the outer jacket material as well.

The code requirements for piping do not address some other system variables known to impact thermal performance. For example, thickness requirements are independent of location within the building. While it can certainly be argued that hydronic piping to a reheat coil routed through a return air plenum, where moving air is increasing heat loss, should have more insulation than a similar line run through a closed cavity in still air, energy codes do not require different insulation thicknesses. 

When considering these energy code requirements, they may appear to be overly simplistic. However, one of the goals of code writing organizations is to state the requirements as simply as possible, while still meeting the intent of the code. Buildings are complicated, with literally thousands of code requirements subject to verification. A good code requirement must be simple and easily verifiable.

While the 2012 IECC minimum thickness requirements for pipe insulation are not dependent on pipe material, it is recognized that code officials may be receptive to alternatives based on a technical analysis demonstrating that the thermal performance of an alternative design is as good as or better than a baseline case meeting the code. For
example, the ASHRAE 90.1-2010 Standard (which formed the basis for the 2012 IECC requirements) has a footnote to the requirement table:

The table is based on steel pipe. Non-metallic pipes Schedule 80 thickness or less shall use the table values. For other non-metallic pipes having thermal resistance greater than that of steel pipe, reduced insulation thicknesses are permitted if documentation is provided
showing that the pipe with the proposed insulation has no more heat transfer per foot than a steel pipe with insulation shown in the table.
This specifically provides flexibility to designers to use thick-walled plastic piping with reduced levels of insulation, provided the alternative design has no more heat transfer than the baseline design.


A number of “Green Codes” or “Stretch Codes” have been developed with the intent of going beyond the minimum requirements in base codes. These model codes are available for jurisdictions or owners who desire improved building performance. Examples include the International Green Construction Code (IgCC), the International Association of
Plumbing and Mechanical Officials (IAPMO) “Green Plumbing and Mechanical Code
Supplement,” and ASHRAE Standard 189.1-2011
“Standard for the Design of High-Performance Green Buildings.” While none of these model codes specifically call out exceptions for insulation on plastic piping, alternative designs are generally allowed if justified by technical analysis. The wording in section 102.1 of the IAPMO Green Supplement is typical:

102.1 General. Nothing in this supplement is intended to prevent the use of systems, methods, or devices of equivalent or superior quality, strength, fire resistance, effectiveness, durability, and safety over those prescribed by this supplement. Technical documentation shall be submitted to the Authority Having Jurisdiction to demonstrate equivalency. The Authority Having Jurisdiction shall have the authority to approve or disapprove the system, method, or device for the intended purpose.


Conclusion

All current building energy codes and standards require pipe insulation on service hot water and HVAC piping. Requirements vary, but none of the model codes differentiate pipe insulation requirements based on pipe material.

For uninsulated or bare pipe, the higher thermal resistance of the plastic pipe walls can significantly reduce heat flow (by roughly 30%) compared to copper piping. As insulation levels are increased, the impact of pipe wall resistance decreases significantly. At the insulation levels required by current energy codes and standards, the impact of pipe wall material on overall heat transfer is small.

In some applications (e.g., condensation control or freeze protection), the lower conductivity of plastic compared to metallic piping materials could be advantageous and may obviate additional thermal insulation. For other applications, additional insulation may be required, depending on the design objectives and the specifics of the situation.

Thermal insulation for mechanical systems has proven to be a simple and cost-effective technology for reducing heat losses and gains in building systems. As energy codes and regulations (both prescriptive and holistic), become more stringent and building owners, operators, and tenants strive for higher performing and more sustainable buildings, designers should be focusing on how and where to use more, not less, insulation. For example, some designers are considering using pipe insulation to conserve scarce water resources, as well as energy, in domestic hot water delivery systems.6 Since the expected useful life of buildings can be 50 years or more, it is significantly easier and more cost-effective to plan for and install proper mechanical insulation systems at the time of
construction than to retrofit or upgrade the insulation systems later. Likewise, when facilities are being renovated or repaired, the opportunity to upgrade mechanical insulation systems should not be overlooked. Efforts to sacrifice mechanical insulation levels to minimize initial costs are counterproductive, and building owners would be better served to focus on examining the long-term performance of building systems.

This article was developed by the National Insulation Association (NIA) and the North American Insulation Manufacturers Association (NAIMA).


References:

  • Barrett, Stephen R. “Potable and Process Pipe and Fitting Advances Utilizing Radio
    Frequency Fusion Welding.” IAPMO Emerging Technologies Symposium, May 1, 2012


  • National Institute of Building Sciences, “The Mechanical Insulation Design Guide,” www.wbdg.org/design/midg.php


  • Plastic Pipe and Fitting Association, “Installation Handbook: CPVC Hot & Cold Water Piping,” 2002.


  • NAHB Research Center, “Design Guide: Residential PEX Water Supply Plumbing Systems,” November 2006.


  • ASTM C680-10, “Standard Practice for Estimate of the Heat Gain or Heat Loss and the Surface Temperatures of Insulated Flat, Cylindrical, and Spherical Systems by Use of
    Computer Programs.” ASTM International, West Conshohocken, Pennsylvania. 2010.


  • Klein, G., “Hot Water Distribution Research,” Insulation Outlook, December 2011.


Copyright Statement

This article was published in the September 2012 issue of Insulation Outlook magazine. Copyright © 2019 National Insulation Association. All rights reserved. The contents of this website and Insulation Outlook magazine may not be reproduced in any means, in whole or in part, without the prior written permission of the publisher and NIA. Any unauthorized duplication is strictly prohibited and would violate NIA’s copyright and may violate other copyright agreements that NIA has with authors and partners. Contact publisher@insulation.org to reprint or reproduce this content.

 

Melamine

Melamine insulation is a low-density, semi-rigid,
open-cell foam intended for use as thermal and sound absorbing insulation at
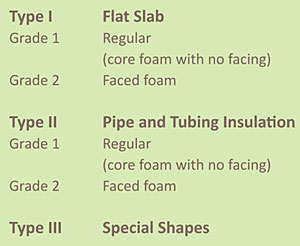
temperatures between -40°F and +350°F. ASTM C 1410 covers this material and
defines the following insulation types and grades:

The specification defines requirements for oxygen
index, optical
smoke density,
surface burning characteristics, density, tensile strength, percent elongation,
indentation force deflection, thermal conductivity, water vapor sorption,
linear shrinkage, and smoke toxicity.

For comparison purposes, the maximum thermal
conductivity at 75°F mean temperature is 0.30 Btu-in / h?ft²?F.

Melamine insulations find application to a variety
of industrial and process applications, including pharmaceutical, food-grade,
and clean room applications. The product is available unfaced or with a number
of different factory-applied jacketing systems.

Figure 1
Figure 2

FMI,
a large provider of management consulting and investment banking to the
engineering and construction industry, recently released the
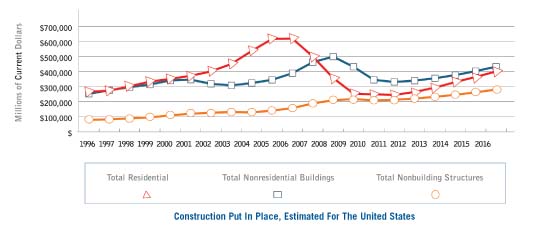
second quarter 2012 Construction Outlook Report. Here are excerpts of
the report’s findings on the construction industry.

There are some brighter spots in construction, and, overall,
we expect there will be 5% more construction put in place [CPIP] than in 2011,
or around $826 billion. Yes, that is only around the levels reached in
2000-2001, but CPIP will again be more than a trillion dollars by 2014?.

We are slowly seeing signs of improvement in some
fundamentals with housing and even manufacturing scratching out a comeback.
Power construction is also a very active area and not just in shale gas
production. Gasoline prices are down for the moment, helping businesses and
consumers alike… Natural gas production presents both good news and some
challenges as more production helps keep the cost to the consumer down.
However, if the price continues to decline, natural gas use will affect the
growth of alternative fuels and slow down new natural gas mining projects.

Construction Forecast

If 2012 does turn out to
be the turning point for construction, it will be a long, slow turn. That may
prove to be a safer road to recovery than a sharp V or U curve. At this point,
we expect CPIP to grow 5% (to $826 billion) and as high as 7% in 2013 (to
$882.4 billion).That improving growth rate includes a solid recovery in
housing, especially multi-family units, and strong growth in power
construction. Other areas, like commercial construction, will awaken from a
long slumber to resume slower than traditional growth rates but somewhat ahead
of national GDP growth. This is more reflective of population demographics than
a rapid recovery.

Office Construction

After falling for three
years, growth in office construction should be 4% by the end of 2012 and
improve to around 6% for 2013 through 2014. Still, these levels, at around
$35.7 billion to $40.1 billion in 2014, are just returning to levels last seen
in the late ?90s. Reflective of the general insecurity in the economy and new
hiring, the national outlook for office construction is continued slow growth.

Trends

  • Vacancy rates changed little,
    with the expected release of shadow inventory to keep them high as companies
    holding onto office space now look to downsize.

  • Sustained low growth in rents
    make it difficult to justify or finance new office space.

  • Green construction and energy
    savings will be the focus of renovation and new buildings.

Commercial Construction

A slow recovery in
commercial/retail construction has helped to keep vacancy rates from rising,
which is good for building owners collecting rent. Despite a number of ongoing
challenges, commercial construction is beginning to grow again, as we expect 5%
growth in CPIP this year, followed by 8% growth in 2013 to around $49 billion.
Growth will be marred by setbacks as currently some big-box retailers like
Sears, JC Penney and Best Buy are rethinking strategies and closing
money-losing stores. Online retail continues to grow as traditional stores move
online. Even in areas ready to grow again, credit may be hard to find as around
$1.73 trillion in commercial real estate loans mature in the next five years. 

Trends

  • Lower gas prices will help raise
    discretionary spending.

  • Upscale urban power centers with
    name-brand anchor stores show continued strength and grocery-anchored malls
    become competitive.

  • Continued slow growth in
    residential construction will help retail stores.  

Health Care Construction

Health
care construction growth has taken a bit of a breather in the last two years,
but the market will recover, thanks mostly to the growing needs of aging baby
boomers. While  only 3% growth in 2012 is expected, it will strengthen to
double digits by 2015, achieving record highs around $52.6 billion. Uncertainty
and conservatism in financial markets as well as political decisions concerning
the health care bill’s future have put a chill on new construction, but
renovation continues strong. Much new construction will focus on ambulatory
facilities and consolidation of small physician-owned facilities, in part due
to reduced payments for Medicare.

Trends

  • Health care construction dropped
    10% in 2010 and was flat in 2011. The forecast for 2012 has been revised to
    just 3% over 2011 levels. Stronger growth will return from 2014 on.

  • Aging U.S. population, new
    technologies, increased single-bedroom demand and increased health care
    consumerism are shaping decisions about new hospital design and location.

  • According
    to the American Society for Healthcare Engineering, seventy-three percent of
    construction is currently for facility renovation and modernization to be
    greener and more patient friendly and to update IT infrastructure.

  • Health
    care construction will use more modern construction techniques such as
    prefabrication, BIM and IPD (integrated project delivery).

Educational Construction

State tax revenues are
again on the rise. According to the National Governors Association and the
National Association of State Budget Officers Survey, “Total state tax revenue
is forecast to rise 4.1% to $690.3 billion in the 2013 budget year.” That news bodes
well for embattled school budgets but doesn’t mean education construction will
be revived right away. FMI’s forecast calls for just a 1% increase in CPIP in
2012 and a slight rise of 2% in 2013. At this point, improving budgets may help
to keep school construction from declining even more, but states also have a
number of other “hungry mouths” to feed, including medical bills, pensions,
roads and bridges to repair and high unemployment.

Trends

  • Funding
    is increasingly a local responsibility as states cut support and local
    government budgets will need to increase property taxes.

  • Greener schools or renovating
    existing schools for improved energy use continues to be a strong trend and
    many major universities have announced they will only build LEED-certified
    facilities.

  • Use of prefabricated/modular
    school construction will increase. Not to be confused with the “temporary”
    classroom units filling playgrounds and parking spaces in growing communities,
    manufactured modular school construction has gained in acceptance for school
    systems looking to save time and money and improve their green footprints.

  • Distance learning and online
    courses are on the rise. Online degrees from universities specializing in
    distance learning are becoming more accepted, especially in a world where
    knowledge workers spend most of their time working in the online world.

  • It will be hard to justify new
    schools for states that have laid off large numbers of teachers.

Manufacturing Construction

Manufacturing
construction is demonstrating sound growth after a sharp drop of 33% in 2010
and a weak 2011. The forecast is for manufacturing construction to rise 3% in
2012 and show steady increases to 2015. Although growth has been uneven,
manufacturing production, led by automotive production, has been on the rise.
At 79.2% in April, capacity utilization is returning to normal levels.
Production for utilities has also seen positive gains, especially for natural
gas. Lower natural gas prices will also help manufacturing energy inputs.
Growth spurts have been difficult to sustain, so manufacturers will be cautious
before adding capacity and employees.

Power Construction

Power construction has
been one of the stronger areas throughout the recession and will continue to
grow faster than all but residential construction over the next five years. In
part, that growth will be because of an anticipated gain in residential
construction due partly to population growth and a growing need for power. Even
though homes and industrial needs are becoming more power efficient, we are
increasing the number of devices, such as the potential for more electric
vehicles that will need electric power generation. Our forecast is for a 10%
rise in construction for 2012 and another 10% in 2013 to $108 billion.
Power-related construction is also in flux as to the type of fuel plants will
use, with the rise in shale gas mining and the demise of outdated coal plants.
Nuclear energy is slow to make a comeback due to regulatory concerns for safety
as well as cost. Alternative energy growth will slow as subsidies are removed.

Trends

  • Emergence of shale gas supply
    fundamentally alters the U.S. energy landscape.

  • U.S. Environmental Protection
    Agency regulations are expected to halt new coal construction, drive premature
    retirement of existing coal-generating capacity and support the shift to
    natural gas power generation.

  • The U.S. nuclear renaissance is
    on hold outside of regulated markets, as the low price of natural gas redirects
    investment. The once foreseen renaissance is now limited to two new reactors
    each at Southern Company’s Vogtle plant in Georgia and South Carolina Electric
    & Gas Company’s Summer plant in near (sic.) Jenkinsville, South Carolina.
    Industry experts anticipate nuclear to retain its near 20% share of generation
    going forward, which will spur future investment.

  • The power transmission and
    distribution market remains robust.

  • Renewable energy is likely to
    stall, as incentives are set to disappear. Extension of the Federal Production
    Tax Credit (PTC), which makes economics of renewable energy favorable for
    producers, is uncertain. The credit is set to expire at the end of the year. As
    of April 3, 2012, the Senate voted not to extend the PTC on four separate
    occasions in 2012.

Conclusion

Despite the constant
confusion of news from Europe and uncertainty and inaction in the U.S. Congress,
there are some positive signs in the economy. As one might expect, improving
housing construction is helping to lead the way, especially multi-family
housing. However, power construction is another strong point, and even
commercial construction will show signs of rising from its slumber.
Nonetheless, slow growth may be even more challenging than large market drops
or boom times, because it requires improved management, precision market
research, and creative business development.

Figure 1

We Live in a New World – the World of Social Media.
Social media changes how
we interact and engage with one another. It is now the number one activity on
the Internet. Facebook reports that it has over 900 million active monthly
users—a number that would constitute the third-largest country in the world behind
China and India. In the United Kingdom alone, 50% of mobile Internet traffic is
for Facebook. More than 95% of companies using social media for recruitment use
LinkedIn, growing at a rate of two new members per second. YouTube is the
second-largest search engine in the world, with more than 25 hours of video
uploaded every minute. Twitter is growing faster than Facebook and adds more
than 320 new accounts and almost 100,000 tweets every minute. More than 34% of
bloggers post opinions about companies and products, which is important to
businesses because only 14% of the public trust advertisements, while 90% rely
on the recommendations of others.

As electronic communication increasingly drives how we do
business, companies not leveraging these tools risk being left behind. Think of
where your business will be in 5 years if you use social media wisely, and
consider what could happen if you don’t. The true return on investment (ROI)
lies in the difference between those two scenarios.

With this mass adoption of social media, it is critical to
understand how you can use it to unleash its power for your business. This
article will describe what I have seen over the past 5 years that works for
companies who use social media successfully to grow their businesses and lower
their risks. These critical factors help organizations to get powerful results
from social media.

Anyone in leadership, regardless of the type of organization
(for profit, not-for-profit, public, or private) should view these Five
Critical Factors as a roadmap for leading their organization through what can
seem a confusing maze. In addition to identifying how powerful and beneficial
this new form of media can be for your organization, this article aims to help
you avoid critical mistakes that could harm your brand or drive away your
customers.

Critical Factor #1:
If You Don’t Know Why, Don’t Do It

It is critical to answer
the “why” question before you do anything with social media. I frequently get
asked to help companies take what they started and turn it around to generate
results. In our first meeting, I always ask “Why do you want to use social
media?” The answer, which often comes after several productive hours of
discussion, helps focus the leadership team on the right issues to help their
business.

A few weeks ago, I met with a company whose leadership
decided they needed a “social media strategy.” They said, “Whatever we are
doing isn’t working and is confusing our customers. We talked about it as a
management team and came to the conclusion that we jumped into using the ‘free
and easy’ tools and really didn’t have a strategy for what we expected to
accomplish. We now realize we need one before we do any more damage to our
brand and our company. Can you help?”
While you might think my immediate
answer was, “But of course, let’s get started!” Actually, I said, “I don’t
know. I have to first understand why you even want to use it.”

When asked what they had done to get to this point, the CEO
said:

We wanted to do
something in social media so we put together a team of younger people from our
marketing group because they understood Facebook and some other tools. We
thought they could set things up and get us in the game. As it turns out, they
knew how to work Facebook and Twitter, but really had limited knowledge on what
our business or brand was about, so our communications were random and usually
off point. It was no fault of theirs; it was a leadership issue and I take full
responsibility for seeking the easy way out. Now I see how much it could cost
us—losing customers or having our brand tarnished. I want to turn this into a
competitive advantage for us but what we are doing isn’t connected to our
business strategy.

They wanted help to get back on track. Unfortunately, their
story isn’t unique. Starting with an understanding of why you want to
use social media (more difficult than most people realize) will give you
clarity, purpose, and direction.

Critical Factor #2:
Get Engaged – Create a Business Engagement Strategy

While
answering why is the best way to understand your purpose, creating a
Business Engagement Strategy is the best way to start planning for the what
and how of using social media. This step truly drives your success or
failure in implementing social media in your organization. If you don’t have a
strategy, or you have the wrong strategy, the implementation will not deliver
the results you want. Defining strategy helps you avoid creating brand
confusion or brand erosion—like what the company in my earlier example
experienced—because your communications will match your organization’s actions
and direction.

A confused customer defects quickly since there are so many
choices available. I can’t emphasize enough how important having a solid
engagement strategy is to your success at incorporating social media into your
company and achieving results. It is so critical that I have never engaged with
a client where we didn’t start with some level of strategy.

An “engagement strategy” is linked to
but different from a business strategy or a marketing strategy. Every business
should have a business strategy—i.e., what you are planning to do in the next 2
to 5 years. Ideally, you should have a marketing strategy as well—knowing what
you are going to say about yourself in advertisements, brochures, mailings,
etc. (your promotion strategy).

An engagement strategy identifies how you are going to
interact and engage with your current and future audiences. Its purpose is
twofold: on one hand, it means having your audience engage/interact with you;
on the other, it means having your company interact and share with people who
are connected to your community. An engagement strategy incorporates three
components: 1) your business strategy; 2) your chosen methods for interacting
with your audience; and 3) your methods for encouraging others to share
information about your company with people in their communities. Knowing these
components separates you from your competition and gives you an edge on getting
your audience to communicate these differences to others.

Creating a successful engagement
strategy involves developing an in-depth understanding of your audience,
including knowledge of who your audience base is, what channels your
audience listens to, what themes help your audience, educating them on what
makes you different from your competitors, and how you can help your audience
to improve their businesses
.

Critical Factor #3:
Word of Mouth Always Has Been, and Still Is, Your Biggest Asset

When my grandfather needed
to buy a cow, he went down to the end of his fence and asked his next-door
neighbor Bob for the name of a trusted cow seller. Bob told him it was Jack.
After that, my grandfather bought his cows from Jack. This marketing is called
word of mouth (WOM), and it is how business has been done for as long as we
have had the means to communicate. Today, it is still the best way to do
business.

WOM marketing has several key
ingredients. It starts with keeping the promises you make. If you don’t do
this, not even social media will save you. When you keep your promises, you
create trust with your customers, employees, and others. Continue doing this
and over a period of time you will build a relationship with these people. As
your relationship grows and trust continues to build, these people will become
your advocates in the market—people who proactively tells others about you.
This is WOM marketing.

The primary benefit of an advocate is that he/she takes
action on your behalf and spreads the word about you to others. Social media
uses the same process for WOM. The main difference with social media is that it
allows your advocates to amplify or share what they are saying to many other
potential customers, instead of just one person or a small group. This is WOM
on steroids! As you read earlier, only 14% of our society believe an
advertisement, whereas 90% believe the recommendations of others. In which
world would you prefer to do business?

Companies spend fortunes on search engine optimization (SEO)
for the purpose of getting on the first page of a search engine, such as Google
or Yahoo. Here’s another perspective. If you are primarily found because your
advocates and others are telling their friends, followers, or connections to go
directly to your site, do you care about your page rank? No. Your customers
aren’t searching for you; they are going directly to your front door and
engaging with you without using a search engine. While SEO is important for
other reasons, it becomes a lot less critical when people show up at your
doorstep because an advocate or someone else told them to go there. Think of
what this means in terms of improving your conversion and closing rates, and
lowering your cost of sale.

Here is a hint for you: Stop collecting friends/followers and
spend more time building advocates. Arm your advocates with great content and
help them in any way that you can. This process alone will generate more buzz
for your company and deliver more results than broadcasting how great your
products/services are.

As you focus on building advocates, it is important to
understand the difference between selling and helping. Selling is the world
most companies live in, telling everyone how great they are and that people
should buy, buy, buy from them. This is how most traditional “push” media is
used today.

Helping, on the other hand, is where the true power of social
media lies: Finding ways to be relevant, interesting, thoughtful, compelling,
and insightful to your audience so their business will grow. That’s what
today’s audience wants. Ask yourself if you are selling or helping. You can
only live on one side or the other—and social media lives on the helping side.
Provide this type of content and your audience will engage more with you, build
a trusted relationship, and tell others about you!

A great example of how this works is
right in NIA’s backyard. NIA President Rick Smith, CEO and President of E.J.
Bartells, and Brian Farnsworth, Vice President of E.J. Bartells, started a blog
last year called “Simplivative.” Their engagement strategy was to create a blog
to share stories and insights to help their customers, employees, vendors,
manufacturers, and others in their industry embrace innovation. In creating
this blog, they started a community for those interested in learning more about
innovation, allowing people from all areas to interact and share their stories.
Normally this approach would be one-to-one, but with the power of social media,
their message can reach a global audience.

Critical Factor #4:
The Tools of Social Media Are Cool, But They Will Change on You

While social media tools
are critical for delivering your messages, the tools (and all of their
intricacies) should be your lowest priority. They are important channels for
communicating your messages, but they aren’t the driver of success, contrary to
many opinions.

The primary purpose of the tools is to deliver your content
and engage people through the channel(s) your audience is listening to or
engaging with. For example, some executives are not big Facebook users (unless
they need to stay in touch with kids who are away at college or their
grandkids), but they are big LinkedIn users. Sharing content through Facebook
won’t reach those executive target audience because they aren’t engaging with
that particular channel or tool. Putting the same message and content on
LinkedIn will have a significantly higher chance of reaching that executive
target audience and allow them to engage with it.

Executives are also rapidly embracing Twitter as a channel
they use for real-time, fresh content. To adapt, we stay on strategy and
deliver our message through the Twitter channel, in addition to the others.
Tomorrow it could be YouTube, Pinterest, Google+, or any of a host of other
tools and channels. The beauty of social media tools is that they are easy to
use, so you can always be where your audience is interacting and engaging. Get
wedded to one channel and you risk the chance of losing your audience.

The tools are free and relatively easy to set up, and this is
where the majority of social media experts consult. This, however, is not the
area of greatest value to you or your company. Unfortunately, like the company
in the earlier example, executives often “throw social media over the wall” to
their younger employees and put them in charge because they know the tools.
This generally misses the mark because they aren’t the employees who understand
the depth of the company’s strategy or brand—they just know how to execute the
tools and communicate over the channels. Bottom line: The tools are clearly
important, but they are only the means of distributing the messages created
based on your company’s strategy.

Critical Factor #5:
Think and Act Small if You Want To Get Big

The future of being
successful using social media resides in being able to identify and talk to a
small, specific, niche-based audience called a community. One size doesn’t fit
all in social media, which is one of the key reasons why traditional media is
failing so rapidly—broad-based promotion and broadcasting falls on deaf ears.
Casting the big net to catch a few fish no longer works because your audience
is listening to specific channels on narrow topics.

For example, I work with a national group of attorneys who
provide legal services to gun owners. Their strategy, theme, content, blog
posts, tweets, and messages on all channels are narrow and only relate
to the legal aspects of owning firearms. Any gun owner interested in learning
about the legal aspects of owning a firearm tunes into their channels and
engages. The attorneys provide helpful, relevant, compelling, insightful, and
thoughtful content to their audience, and then the audience shares this content
with their fellow gun owners—i.e., other members of their community. Every
audience is part of some community when it comes to content.

Blogs are the key to being able to talk to your community and
give them the content they want. When you help them get what they need, they
share your information with other members of their community. This is how
websites and information go viral.

Wrapping up

These
are the Five Critical Factors that every organization needs to understand
before stepping into social media. Using social media the right way gives you a
recipe for success and the opportunity to achieve results. Follow these steps
and you will be able to leverage the true power of the revolution today!


Phenolic

Phenolic
insulation is rigid foam insulation with a closed-cell structure. It is
manufactured as large rectangular buns typically 4 ft. wide x 3-12 ft. long x
1-2 ft. tall at a density of 2 lbs/ft³. Prior to actual installation, buns are
fabricated into various shapes, including flat boards and preformed pipe
half-shells 3 ft. long, and designed to fit over NPS pipe and tubing. More
complex shapes can also be fabricated to fit around fittings, elbows, and other
equipment. ASTM material specification C 1126, Type III, Grade 1 covers this
type of insulation at service temperatures from -290°F to 257°F.

The specification defines requirements for density, compressive
resistance, thermal conductivity, water absorption, water vapor permeability,
and dimensional stability. While this ASTM spec lists two grades and three
types, only the Type III, Grade 1 is appropriate for use in pipe insulation.
The other types are boards, either faced with a vapor retarder or not, and used
for building sheathing and roofing, respectively. Grade 2 is an open cell
product. For comparison purposes, the maximum thermal conductivities at 75°F
for the Type III, Grade 1 phenolic insulation is 0.13 Btu-in/hr-ft²-°F.

Key
applications for phenolic insulation are on pipe, equipment, tanks, and ducts,
especially those operating at temperatures below ambient.

Figure 1

Executive Summary:
Everything Changes While Staying Relatively the Same

In
the 12 months since the last Black & Veatch electric utility industry
report, the industry has seen its primary fuel choice challenged and natural
gas prices drop to levels not seen since 2001. A historically warm winter
across much of the country drove down consumption (and hence revenue), creating
a cash crunch for many utilities. Further, the industry’s hopes for some
progress on the regulation of carbon continue to wax and wane in a U.S.
Congress unable to make a decision.

Yet for all of the changes across political, economic, and
cultural lines, results from this year’s report are strikingly consistent with
those of the past three years in terms of concerns, worries, and the potential
impacts of regulation and other requirements. Perhaps it is the historic focus
of the industry on reliability and safety; perhaps it is a return to
back-to-basics management approaches; or perhaps it is the generally
conservative nature of the industry, which results in this remarkable
consistency from year-to-year.

Black & Veatch conducted its sixth
annual electric utility industry survey from February 22?March 23, 2012.
Analyzed survey responses are from qualified electric utility industry
participants. Statistical significance testing was conducted, and the
represented results have a 95% confidence level.

Utility respondents represented a broad cross section of the
industry and country. The eight mainland regional reliability councils, under
the North American Electric Reliability Corporation, were represented in this
survey. Responses were also grouped by four geographic regions to give
additional insights into geographic differences.

Key Survey Findings

The
industry, according to the survey, continues to hold fast to some fundamental
beliefs: that there will be some certainty on carbon; that prices for
electricity will continue to rise; that, while coal has a future, renewables
have a growing but limited one; and that water is a critical environmental
concern. There is also significant agreement in several areas, and this is
interesting because, typically, a survey of the general public, regulators, and
legislators on the same topics would yield different results. When it comes to
“viable clean energy” technologies, for example, the “big three” that electric
utilities project for 2020 are natural gas, hydroelectric, and nuclear. It is
doubtful that the general public would rate any of those choices as
particularly “green” technologies.

More than 90% of utility respondents believe, however, that
renewables will increase prices for consumers anywhere from 5 to 30%, with the
largest percentage (38%) assuming a 10% increase for their customers. This may
tie to the 65% of utility respondents who reported rate increases during the
past year, and the 92% who reported that the cost of regulations will cause
prices to rise for consumers. More than 60% of utility respondents believe they
will hit their renewable energy targets?but a surprising 25% of utility
respondents stated they do not know if it is achievable. One has to wonder
whether the pending increase in rates, due to renewables, and the potential
demise of the production tax credit are behind this uncertainty.

Reliability, aging infrastructure (not workforce), and the
environment continue their reign as the top industry concerns, followed closely
by the need for long-term investment. Interestingly, security and technology?inextricably
linked in terms of deployment?are tied in the fifth position. While water did
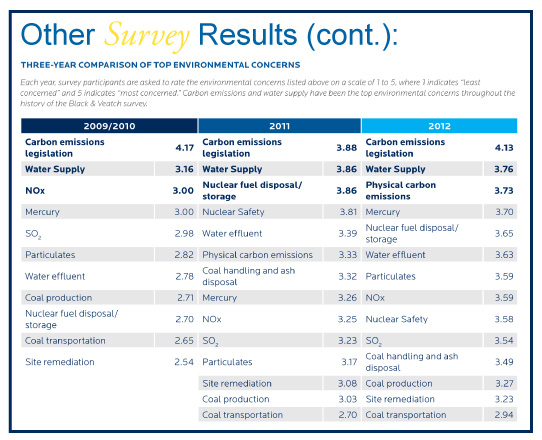
not make the Top Ten Issues list, it did come in second only to carbon
emissions legislation, in terms of environmental concerns. In fact, when water
supply (second) and water effluent (sixth) are combined, they rise to the top
of environmental concerns.

The hope for certainty in carbon emissions legislation is
common across all regions and, as it has been since 2008, leads the ranking in
environmental concerns, followed closely by water supply. Interestingly, when
broken down into the four geographic regions, Northeast respondents rank
disposal and storage of nuclear fuel as their top concerns?an issue that does
not even make the top three in the Midwest, South, or West. The concern over
nuclear disposal, overall, jumped significantly since 2009 when it was near the
bottom of industry issues?likely due to the lingering influence of the
unfortunate incidents at Fukushima, as well as the abandonment of plans for a
national geologic storage facility at Yucca Mountain.

The potential impact of environmental regulation continues to
be a primary focus for utility survey respondents. It is interesting to note
that the survey’s timeframe in March pre-dated, and yet predicted, the U.S.
Environmental Protection Agency’s (EPA) and Department of Interior’s new
hydraulic fracturing rules issued in May. More than 80% of respondents saw this
coming in their crystal balls. Of course, 93% of survey respondents believe
these new rules, and any subsequent rule additions, will have a significant or
slight upward pressure on the price of natural gas. Respondents’ prediction on
the price of natural gas in 2020 showed a virtual tie between $4-$6 per one
million British Thermal units (MMBtu) and $6-$8 per MMBtu. More than one-fifth
of survey respondents (22%), perhaps those who have been around to watch
historical gas price fluctuations, reported not knowing what the price will be
in the same period.

Regulations are also causing concern
regarding the operational effectiveness of utilities as well as concern for
increasing rates. A full 86% of respondents believe there will be impacts on
operational effectiveness, with 16% believing it will be “significant.”
Regulatory impacts are also key drivers in investment, the development of
sustainability plans, and the perception of utilities on Wall Street?either for
stock prices or bond ratings. Concern over whether or not utilities will be
able to recover adequate returns on investment?or any costs for that matter?for
smart grid investments weigh on the minds of utility respondents. This is
especially true now that American Recovery and Reinvestment Act dollars are
almost gone.

Smart grid, which burst onto the survey
scene several years ago, continues to struggle from “a lack of customer
interest and knowledge,” which utility respondents view as the single greatest
impediment to investment programs. Yet, when pressed further, more and more
companies are investing in systems to improve customer communications, which
are driven by smart systems. More than three-fourths (76.9%) will be building
customer self-service websites, expanding their web presence, social media, and
potentially implementing variable rates?all areas in which the smart grid is a
key component or at least a primary enabler. It may be that the grudging
acceptance of intelligent infrastructure is part of the historically
conservative nature of the business, where even “fast followers” are viewed as
radically different and risk-takers.

Regulation at the federal and state/local level is also
influencing the market for merger and acquisition (M&A) activity. The
2011/2012 timeframe has seen three significant mergers and acquisitions and,
for the first time, the Black & Veatch survey looked at the impacts of
these activities. With Exelon/Constellation, Duke/Progress, and Northeast Utilities/Nstar
each at some stage in the M&A process, all utilities are considering their own futures and what these mergers
really mean. The vast majority see financial scale, rather than operating
synergies, as a driving force of profitability in this area moving forward. The
benefits of scale are particularly apparent when considering that regulators
require most utilities to either hand over, or at least share, cost-cutting and
operational savings with customers?especially in light of continued slow load
growth or declining kilowatt hour sales.

Looking at the numbers, the industry has changed remarkably
in some capacities, while remaining steady in its core function. For example,
58% of utility respondents believe, “When fiscal realities are fully considered
in the United States,” there is still a future for coal. This is a significant
drop from the 81.5% who indicated this to be the case in last year’s survey. As
noted within, the industry is taking more environmental concerns into account
than ever before, even though nearly a third (29.2%) believe that global
warming is still “speculative.” It is not unexpected that an industry that
prides itself on reliability, safety, and long-term investment focuses so
intently on certainty, potentially at the risk of missing dynamic changes. It
could be as Voltaire once noted, “Doubt is not a pleasant condition, but
certainty is absurd,” as many more surprises are to come in this rapidly
changing, energy market.


Sidebar: Implications of Domestic Natural Gas

By Greg Hopper

North American natural gas reserves, once thought to be
high-cost and diminishing in nature, have reversed course and now are expected
to serve as a baseload energy source for decades to come. Driving this change
are the technological advances in the exploration and production of
non-conventional reserves, most notably shale gas, which has rejuvenated the
gas industry. The massive scale and accessibility of North American shale gas
has many implications for consumers and businesses, particularly in the
electric industry.

Though the industry is more than 10 years into the
development of shale gas resources, estimates of economically recoverable North
American natural gas have increased year-over-year. Recent estimates by the
Energy Information Administration indicate that technically recoverable gas
resources in the United States exceed 2,200 trillion cubic feet (Tcf). At
current consumption levels, this equates to approximately 90 years of supply to
meet market demands. While the question concerning the adequacy of available
gas resources is now of less interest to industry stakeholders, the location of
specific resources, the cost of extracting them, and the construction of
pipelines to deliver them to market, are now key issues facing gas market
participants.

Finding and development costs for shale resources are heavily
influenced by the properties of the specific shale rocks and the costs of fully
completing a producing well. Technology and improved understanding of shale
formations have cut the cost of production nearly in half in the last 5 years.
Notwithstanding, rising environmental costs are expected to impart upward
pressure on the price of gas over time. The extent to which regional
environmental costs add to price increases may cause shifts in the location of
shale production.

Low gas prices stimulate new markets. In 2008, natural gas
prices at the Henry Hub in southern Louisiana, a primary price reference point
for the global natural gas market, topped $13 per MMBtu. During the price run
up, power generators?driven by emissions concerns, fiscal pressures, and the
need for reliable fuel stocks?pivoted their capital investments for future
generation needs to the development of renewables, nuclear, and clean coal
technologies.

Since that time, rapid shale gas production growth from
multiple supply basins has created a supply “bubble” that dropped the spring
2012 prices below $2 per MMBtu. The drive to produce highly valuable natural
gas liquids in tandem with shale gas has subsidized the cost of producing
natural gas. However, few industry watchers expect prices will remain this low.
Black & Veatch’s most recent energy market forecast projects the price range
will be between $4-6 per MMBtu through 2020. Survey responses align with this
projection, with 37% agreeing that gas prices will be $6 per MMBtu or lower by
2020. In contrast, only 12% expect prices will be $8 per MMBtu or higher.

Lower prices and increasing energy industry confidence that
shale resources are large and sustainable, have positioned the gas industry to
capture the lion’s share of new generating capacity builds for the foreseeable
future. Although renewables and nuclear investments will continue to be part of
the fleet, natural gas is clearly the preferred technology to replace coal as
North America’s primary energy source. In addition to natural gas’ low price,
the decreased price volatility that accompanies its plentiful production
further increases the attractiveness of gas to utility and merchant generators
alike.

Risks center on safety and environmental concerns. Although
the energy industry has gained confidence in the geology and technology
underlying the economics of shale and non-conventional production, concerns
remain about the risks of environmental and political opposition. As noted in
the survey results, more than 80% of utility respondents expect that the EPA
will impose regulations to regulate hydraulic fracturing activity as it relates
to water. In particular, concerns about hydraulic fracturing safety have risen
as numerous federal and state government agencies, as well as public watchdog
groups, have reacted to the rapid growth of shale-gas fields. The opposition
has been greatest in locations such as New York, where there is little or no
prior experience with petroleum resource developments. Common objections have
centered on potential impacts to drinking water supplies, air emissions, and
road traffic.

The most frequent issue cited by opponents of hydraulic
fracturing is the large volume of water required for the process, added
chemicals, and whether the use of these supplies threatens the adequacy of
water needed by other types of users. A report commissioned in 2009 by the U.S.
Department of Energy, the Ground Water Protection Council, and ALL Consulting,
LLC found that a typical shale-gas well requires at least 3 to 4 million
gallons of water for drilling and completion, including hydraulic fracturing.
Water transportation, handling, and the precautions taken to prevent wastewater
spills can be a logistical challenge?especially in Pennsylvania where geology
and regulations do not support injection wells. As such, the transportation of
wastewater to disposal wells in Ohio generates a significant cost.

Research conducted by Black & Veatch showed that shale
gas water costs are higher than those for industrial water in the 50 largest
U.S. cities. As of 2010, shale-gas developers paid at least 1.4 cents per
gallon for source water, and another 11 to 16 cents per gallon to handle the
wastewater. By contrast, the most expensive industrial water associated with
municipalities was 0.7 cent per gallon for source water and 1.7 cents per
gallon for wastewater. This research is consistent with the survey results, in
which 70% of utility respondents expect EPA regulation of hydraulic fracturing
and water use will influence natural gas prices but not substantially. However,
shale gas developers are highly motivated to reduce water costs and have moved
toward recycling and on-site treatment to reduce total volume and
transportation needs.

Evolving Pipeline Infrastructure Needs

The
North American natural gas pipeline grid was primarily built to move natural
gas from the Gulf Coast, southwestern United States, and western Canada, to
consumer markets throughout North America. The emerging shale basins in the
Northeast, predominantly the Marcellus basin located in Pennsylvania, New York,
and West Virginia, have created substantial changes to the movement of gas
supplies across the country. Pipelines constructed to transport gas from Texas
and Louisiana to the Northeast are now experiencing substantial drops in
volume, as Marcellus production grows. In some cases, gas is now being shipped
from the Northeast back to Louisiana to avoid bottlenecks in Pennsylvania and
access the more liquid Gulf Coast gas market.

This shift of supply has in turn created the resurgence of
pipeline rate cases to redesign rates or establish new billing determinants.
Pipelines and their customers are both considering innovative ways to
reapportion cost and fairly allocate risks, as contracting and shipping volumes
change. As increased gas is used for power generation, concern is growing as to
whether adequate pipeline infrastructure will exist to deliver supplies to
power plants on a reliable basis. Numerous studies are underway by various
parties to assess the compatibility of the electric and gas grids and the need
for additional infrastructure investments.

Impacts to the
Electric Industry

Overall, the shift towards natural gas and the growing
resource base in North America are creating price stability and long-term
assurance of natural gas as a generation fuel. Natural gas is now viewed as the
clear leader among clean energy technologies to address greenhouse gas
emissions (natural gas has only 42% of the carbon output of coal) in the United
States. Natural gas is now tied with nuclear when it comes to environmentally
friendly technologies that the industry should emphasize. In addition, nearly
80% of all survey respondents, representing utilities and non-utility
organizations, viewed natural gas as an economically viable technology without
portfolio standards, credits, or subsidies. Comparatively, just over half of
respondents indicated this will be the case for nuclear
.

This shift will require different
approaches in obtaining and managing natural gas as fuel to a growing North
American gas-fired power generation fleet. To take advantage of gas supply
resources, utilities must first reevaluate their existing gas supply
portfolios. It is important to learn where flexibilities exist in order to
reconfigure the fuel portfolio to lower costs and to reach shale resource
supply basins. Within the gas supply portfolio, utilities will need optionality
through transportation, storage, and delivered supply. This will allow
utilities to reposition supply access as opportunities arise. Finally,
utilities should explore participation in the natural gas supply chain as an
investor, by bringing demand and capacity commitments to fund additional and
needed infrastructure.


This report was reprinted, in part, with permission
from Black & Veatch. The full report is available at http://bv.com/docs/management-consulting-brochures/2012-electric-utility-report-web.pdf.

Black
& Veatch is an employee-owned, global leader in building Critical Human
Infrastructure? in Energy, Water, Telecommunications, and Government Services.
Since 1915, they have helped their clients improve the lives of people in over
100 countries through consulting, engineering, construction, operations, and
program management.


Figure 1
Figure 2

At the Annual NIA Convention in Scottsdale,
Arizona this past April, approximately 40 NIA members met with the
platinum-award winners of the Theodore H. Brodie Distinguished Safety Award to
discuss ideas and suggestions for creating and maintaining a top-notch safety
program. The group consisted of a wide variety of members, from insulation
contractors to distributors/fabricators and associates. This roundtable has
proven to be an extremely valuable resource for attendees who are concerned
about maintaining the highest-level safety program possible and minimizing
on-the-job injuries. Workplace safety is becoming increasingly important, not
only from the standpoint of reducing injuries and their resulting costs, but
also when it comes to avoiding OSHA citations that can adversely affect a
company’s ability to compete for contracts.

Winning
Recommendations

All of the platinum-award winners emphasized
the importance of making safety a priority. One of the key components of
implementing an effective safety program is the proper training of new
employees. One of the smaller contractors said that his company devotes half a
day with new hires to train them on safety protocols; while some of our larger
contractors report that a full day or more is spent making sure that new
employees are effectively trained in safety.

Part of training involves testing, which helps
employers to gage their employees’ knowledge of the rules and regulations. All
platinum-award winners said that they test employees after their safety
training to ascertain their understanding of the material. The winners
indicated that employees who do not meet the company standards for safety
knowledge are not permitted to work until they can demonstrate a sufficient
knowledge of critical safety issues. One
contractor indicated that his company conducts a pre-hire evaluation of the e
mployee’s safety understanding and then tailors
its training to supplemen
t
the employee’s existing knowledge.

Regular meetings that
continually train employees on safety requirements, while also giving employees
a chance to mention any safety issues that have recently occurred, are also an
important part of maintaining a strong safety program. All of the
platinum-award winners conduct, at least, weekly safety training through
various forums, such as toolbox talks or safety huddles. Most of the winners
also have daily safety briefings to keep employees focused on safety as they go
about their day-to-day activities.

Several of the platinum-award winners shared the
fact that they regularly begin the workday with stretch and flex programs to
get their employees loosened up to avoid sprain/strain types of injuries. Such
a program is actually beyond any OSHA requirement, but contractors and
distributors who practice this routine assert that it has a definite impact on
reducing soft tissue injuries.

Member Strategies

During the roundtable discussion, many members shared their unique
strategies for fostering a safe work environment. One of the
distributor/fabricator members shared his efforts to promote workplace safety.
He has a policy of conducting morning meetings with employees to ensure that
they have an opportunity to share their safety concerns with their supervisors
and make certain that they are using the proper equipment. He also empowers his
employees and his fabrication team to write down suggestions for solving safety
issues that arise on the job and to bring those suggestions and concerns to the
attention of the Operations Manager.

One of the associate members ensures that new
employees receive safety training immediately after they are hired. His company
has a monthly safety program and devotes a high level of attention to the proper
use of personal protective equipment. During management meetings, safety is the
first item on the agenda.

Owner Sets the
Tone

Many of attendees shared the fact that they believe that the
owner/president of the company is responsible for setting the standard when it
comes to safety. The owner/president needs to make sure that everyone is aware
of the company’s safety procedures. For instance, in one medium-sized company,
the owner provides new hires with an orientation on safety to emphasize its
importance as they begin their careers with the company.

One of the platinum-award
winners reported that no one in his company took safety seriously 20 years ago.
Now, safety is a core value of his business. In order to keep the safety
message fresh, the company has weekly safety meetings. Employees who are
observed being unsafe are required to give a safety talk at the next safety
meeting to discuss their mistake(s), in addition to any other discipline they
might receive.

Several contractors addressed the difficulty that
many members face to make sure their employees follow safety rules when they
are working as a subcontractor on a project, and the other contractors working
on the site are not taking safety seriously. How do you instill a safety
culture in your employees when the general contractor’s employees don’t take
their own safety program seriously? Whether this is a widespread problem or
not, contractors who face this type of situation have to be even more diligent
when conducting safety audits of their job sites to ensure that their employees
are the exception on the job, rather than the rule. You cannot let your safety
program slip just because no other contractor on the job is focusing on safety.

Safety Incentive
Programs

Safety incentive programs took up a portion
of the roundtable time because of the recent memorandum from OSHA indicating
that safety incentive programs that rely on records of lost time from injuries
or recordable injuries will be scrutinized as a potential violation of Section
11c of the Occupational Safety and Health Act. While attendees at the
roundtable who use safety incentive programs primarily rely on the findings
from safety audits (and this type of incentive program does not violate Section
11c), it is important to address this issue. The recent memorandum stated that
if you base an incentive program?and incentives can include individual cash
awards, crew lunches, awarding points to employees that they can use to
purchase various items, and recognition at company meetings?on the lack of
workers’ compensation claims and/or recordable injuries, you could be violating
11c. It is important to remember that an incentive program must be based on
safety performance and safety audits, not on workers’ compensation claims or
recordable injuries.

The
Future of Safety

All attendees felt that the roundtable
provided valuable information to aid them in maintaining their own safety
programs. While safety has always been an important aspect of any job, it is
becoming increasingly important in the insulation industry today. More focus is
being placed on safety compliance and safe work sites by owners, general
contractors, and mechanical contractors. Therefore, the NIA is committed to
providing opportunities to members to enhance their safety knowledge and
strengthen their safety programs. We want to remind all NIA members that
participation in the 2012 Theodore H. Brodie Distinguished Safety Award
competition, will no longer be limited to distributor/fabricators and
contractors. Associate members now have the opportunity to participate in this
competition, as a result of the Associates Committee’s meeting at the
convention. The NIA Safety & Health Committee strongly urges all NIA
members to participate in this valuable program not only to get an assessment
of their individual safety programs, but also to see how their company stacks
up in the industry.


With today’s emphasis on green technology, mechanical insulation
should be in the spotlight. However, often, mechanical insulation has remained
the forgotten technology, due to the general public’s lack of knowledge about
the field. As an industry, our goal is to bridge this gap and make sure that
end users and decision makers are aware of the importance of mechanical
insulation.

In order to expand awareness of the mechanical
insulation industry, the NIA teamed with the Department of Energy (DOE) and the
International Association of Heat and Frost Insulators and Allied Workers
(International) to create the Mechanical Insulation Education & Awareness
E-Learning Series.

What
Is It?

The Mechanical Insulation Education & Awareness E-Learning
Series is a web-based, interactive, educational tool, designed to provide an
overview of the mechanical insulation industry. It includes a definition of the
industry, descriptions of the different types of materials used as insulators,
a list of the benefits of properly installing mechanical insulation, and much
more. The series consists of five modules that range from 15 to 35 minutes, and
several additional resources, such as a glossary of industry terms and links to
the Simple Calculators. In just over 2 hours, you can complete the entire
series. However, if something comes up, you can stop at any point. When you
want to continue, you can pick up exactly where you left off. This free series
is available at www.nterlearning.org.

Module 1:
Educational Series Introduction and Defining Mechanical Insulation

This module provides a short overview of the series, discusses
mechanical insulation in comparison to other types of insulation, and provides
information on the National Institute of Building Sciences’ Mechanical
Insulation Design Guide (MIDG). This module includes interactive demonstrations
of several of the Simple Calculators, including the Condensation Control
Calculator for Horizontal Pipe, the Energy Calculator for Equipment (Vertical
Flat Surfaces), the Energy Calculator for Horizontal Piping, the Mechanical
Insulation Financial Calculator, the Estimate Time to Freezing for Water in an
Insulated Pipe Calculator, the Personnel Protection Calculator for Horizontal
Piping, the Temperature Drop Calculator for Air Ducts, and the Temperature Drop
Calculator for Hydronic Piping.

Module 2:
Benefits of Mechanical Insulation

Properly designed insulation systems can
reduce energy consumption and greenhouse gas emissions, play an important role
in sustainable design initiatives and safety programs, increase manufacturing
productivity, control condensation and mold growth, and provide an unrivaled
Return on Investment (ROI), so why is it the forgotten technology?
This
module provides an overview of the advantages of mechanical insulation in the
new construction, renovation, and maintenance arenas when designed, installed,
and maintained properly.

Module 3:
Mechanical Insulation Science and Technology

The power of insulation is based on the physical laws of energy,
and its success lies in the ability of engineers, specifiers, and contractors
to properly design and install the systems. This module presents an overview of
the science of energy and thermodynamics, a more precise definition of
insulation, a discussion of psychrometrics (the study of air and water
mixtures), and a listing of technical mechanical insulation definitions and
terminology.

Module 4:
Mechanical Insulation Design Objectives and Considerations

Most engineers, architects, specifiers, and
end users are familiar with the use of insulation in home and building
envelopes, but are not as familiar with mechanical insulation used on pipes,
ducts, tanks, and equipment. Mechanical insulation may be used to satisfy the
following design objectives: condensation control, energy conservation,
economic savings, extension of equipment life, fire safety, freeze protection,
personnel protection, process control, and noise control. Design considerations
include abuse resistance, corrosion under insulation, indoor air quality,
maintainability, regulatory considerations, service and location, and equipment
life.

Module 5:
Mechanical Insulation Maintenance

Insulation systems, like all mechanical systems, require periodic
inspection and maintenance. With time, insulation systems can be damaged in a
variety of ways, and, if not repaired or replaced, can become less effective. 

How the
E-Learning Series Was Developed

The NIA teamed with the International to spearhead a mechanical
insulation advocacy campaign on Capitol Hill. The purpose of this campaign was
to allocate funds toward fostering awareness of the mechanical insulation
industry. As a result of these efforts, the federal government allocated
$500,000, directed through the 2010 Water and Energy Development Appropriations
bill, to the DOE. This appropriation was intended for developing a Mechanical
Insulation Education and Awareness Campaign (MIC). Once the funds were made
available, the NIA worked with the DOE (and its contractor, Project Performance
Corporation) and the International to create the Mechanical Insulation
Education & Awareness E-Learning Series. Other results of the MIC campaign
include the Simple Calculators and continued research on the benefits of
mechanical insulation, such as the Montana Pilot Program and the study on
energy benefits from insulating schools and hospitals.

Uses

The modules are a free resource, intended for
a wide variety of uses. They can be used as a training resource for companies
and educational institutions; as a marketing tool for potential customers; to
educate decision makers about the importance of mechanical insulation; and to
demonstrate the impact of mechanical insulation when it comes to reducing
energy costs and lowering the expenditure of fossil fuels. No matter how you
fit into the industry, the modules are a great resource for you.

NTER

The E-Learning modules are hosted on the National Training and Education
Resource (NTER) website (www.nterlearning.org). NTER provides a platform
that facilitates the development of training in specialized fields, with its
built-in authoring capability and content creation tools (such as 3D
animation). NTER allows subject matter experts to create sophisticated courses,
without needing to have advanced computer software skills. NTER has a single
sign-on and is completely web-based, which means you don’t need to download any
software to use the learning modules. Accessing software from the web (as
opposed to downloading software) makes NTER a safe and viable educational tool.

Open Source

In addition to accessing the modules from NTER’s website, users
can also combine the modules with their own company initiatives, such as
training programs, sales pitches, and industry presentations. Unlike other
platforms, the NTER website fosters the sharing of information by enabling all
users to clone and download programs.

Cloning involves copying the website and launching an identical version,
or clone, on your own server. Downloading means copying the code of the
website onto your computer, which allows you to modify the code, as long as you
have programming knowledge.

A Great Resource

Whether you decide to access the modules from NTER’s website, www.nterlearning.org,
or choose to clone/download the modules, the E-Learning series is great
resource for all members of the insulation industry. It is a fast and effective
way to train new employees, demonstrate the benefits of mechanical insulation
to potential customers, and access great resources, such as the Simple
Calculators. It can educate decision makers about the benefits of the
mechanical insulation, from its unbeatable ROI to its ability to reduce
greenhouse gas emissions. If you haven’t checked out the modules yet, what are
you waiting for?


Summary

One of the main purposes of insulation on pipe and mechanical equipment operating at below-ambient temperatures is to prevent condensation on the outer surface of the insulation system. Preventing this surface condensation is simple in concept: merely design the system to keep the surface temperature of the insulation system above the dew point temperature of the surrounding air. However, this simple relationship is made complicated because both temperatures are dependent on the interrelationship of a myriad of factors. All of these factors must be fully and properly considered or selected to assure optimum control of insulation system surface condensation commonly called condensation control.

Part One of this series from the July 2012 issue of Insulation Outlook discusses the influence of the design and climatic factors that affect condensation control. By understanding these variables, it is possible to identify the appropriate value for each factor and avoid some common mistakes related to achieving condensation control. Part Two, which ran in Insulation Outlook’s August 2012 issue, focuses on the practical application of this knowledge, with a discussion of the optimal design conditions and system components to reduce condensation in mechanical insulation systems.

Background

Pipe, tanks, ducts, vessels, and other mechanical equipment operating at below-ambient temperatures are insulated for various reasons, with a key one being to prevent  condensation of water vapor from the ambient atmosphere on the exterior surface of the insulation system. Condensation can lead to numerous problems including the following:

  • Safety hazards, as the water drips onto the floor below
  • Damage to inventory, as the water drips onto the merchandise below
  • Poor aesthetics when dripping water stains ceiling tiles
  • Damage to the insulation system materials
  • Reduced insulating ability of the insulation (increased k-Factor)
  • Shortened insulation system lifespan
  • Corrosion of jacketing or pipe
  • Growth of mold on the insulation system surface or on other building materials where condensed water drips

Because of these potential problems, the prevention of condensation on the surface of cold mechanical insulation systems is of critical importance. This article will discuss the causes of surface condensation, the factors influencing it, and how to best identify design conditions and select system components to prevent surface condensation on mechanical insulation systems.

Various tables or charts are presented that show the insulation thickness necessary to prevent condensation under various conditions. These thicknesses were not generated through experimentation, but are based on common modeling or thickness calculations using the ASTM C680 standard thickness calculation method. This is the normal method for designing insulation thicknesses in the mechanical insulation industry. All of the thickness charts or tables presented assume that the material properties and ambient conditions are correctly known, but that is not always the case. These charts or tables also assume that the insulation system is working perfectly and is impervious to water and water vapor penetration, which is not always correct. However, these assumptions are useful and necessary for the purpose of this discussion. While the water resistance of various system components is important, especially in a cold pipe application, that is a subject for another time. There will be no discussion here related to which insulation or vapor retarder materials have better or worse resistance to water.

This discussion will be limited solely to insulating to achieve condensation control. Other design criteria, including meeting energy code requirements, achieving heat gain limits, maintaining temperature control, and freeze protection, will not be addressed.

The theory of surface condensation will be presented first, followed by the influence of climatic conditions and system components on surface condensation. Lastly, recommendations will be made on how to best work with climatic conditions and system components to prevent surface condensation.

Theory of Surface Condensation

Surface condensation occurs when water vapor in the air condenses on a surface that is below the dew point temperature of the surrounding air. This is a complicated topic when
applied to mechanical insulation systems because there are so many factors that influence either the dew point or the surface temperature of the insulation system. Figure 1 illustrates this concept and lists the various factors affecting each component of the equation. The factors shown in red will be discussed in detail.

figure-1-jy-surfacecond


The system designer must understand this theory, select the appropriate design for climatic conditions and the proper insulation system components, and then determine the required insulation thickness to achieve the desired performance.

Influence of Climate Conditions

Ambient Temperature

The first climatic condition to be examined for its influence on insulation surface condensation is ambient temperature. Table 1 shows how insulation thickness has to be
adjusted to prevent surface condensation as the ambient temperature changes. This is shown for a very cold pipe at -80°F, as well as for a pipe at 20°F. The insulation material used for this table is Polyisocyanurate (PIR), which is specified by ASTM C591 as Grade 2, Type IV. The specific, constant conditions used for this table were 90% r.h., 7 mph wind, aluminum jacket with an emittance (
Ɛ) of 0.1, and horizontal pipe. The pipe size, ambient temperature, and pipe temperature were varied as shown.

table-1-jy-surfacecond

As Table 1 shows, a higher ambient temperature can lead to a slightly increased insulation thickness needed to prevent surface condensation, but this influence is small and only typically seen at higher pipe temperatures. For the system designer, this means that it is acceptable to determine the ambient design temperature only roughly; there is no need to
expend significant effort pinning down this design variable. While the ambient temperature plays only a small role in condensation control, it is a key factor in energy conservation and other design criteria, which are not addressed in this article.

Ambient Relative Humidity

The influence of ambient relative humidity (r.h.) on surface condensation is shown in Figure 2, which displays the insulation thickness necessary to prevent surface condensation, as the ambient r.h. changes. This is shown for a very cold pipe at -80°F, as well as for a pipe at 20°F. The insulation material used for these charts is again PIR. The specific constant conditions used for these charts are 90°F ambient temperature, 7 mph wind, aluminum jacket with an emittance (Ɛ) of 0.1, and horizontal pipe. The pipe
size, ambient r.h., and pipe temperature are varied as shown.

figure-2-jy-surfacecond

As Figure 2 shows, the influence of r.h. on surface condensation is very large, especially as the r.h. gets above around 70-80%. As the r.h. increases, the insulation thickness necessary to prevent surface condensation increases. This effect is present regardless of pipe size and pipe temperature, and is particularly pronounced at an r.h. above about 80%. It is important to note that the insulation thickness required to prevent surface condensation asymptotically approaches infinity, as the r.h. approaches 100%. In other words, designing a system to prevent condensation at 100% r.h. would require the use of an infinite thickness of insulation, which is obviously impossible. As a result of this asymptotic behavior, above a r.h. of around 90-95%, it takes an unrealistic and impractical insulation thickness to prevent condensation. This leads to a practical design limit for r.h. of around 90-95%.

In Figure 2 and many later graphs and tables showing insulation thickness, sections are highlighted in yellow to indicate “unrealistic thicknesses.” These are insulation thicknesses that the engineer/specifier would likely consider too large to be considered practical in the specified application. There would certainly be debate as to what thickness is considered “unrealistic,” and these yellow highlights are not meant to indicate some specific point at which insulation thickness becomes unrealistic. Rather, they are intended to help illustrate the concept that there are practical limits that play a role in the system design, in addition to theoretical factors.

Since most cold pipe systems are designed using a fairly high r.h., the influence of this factor is of paramount importance. Consider the five insulation system scenarios shown in Table 2 for the usually important 80-95% r.h. range. For each scenario, the insulation thickness required to prevent surface condensation is shown as a function of high percent, relative to humidity. As Table 2 shows, the insulation thickness required increases very rapidly above about 80-85% r.h., especially at colder pipe temperatures. Impractical insulation thicknesses are reached at 85-95% r.h., depending on the pipe temperature.

table-2-jy-surfacecond

As the pipe temperature in an application gets colder, the specifier of an insulation system will typically reduce the r.h. or introduce other design features, such as higher jacket emittance, in order to avoid the need for unrealistic insulation thicknesses.

Ambient Wind Speed

In a cold pipe situation, the surface temperature of the insulation system will be below that of the surrounding atmosphere. Wind will increase the rate of heat transfer and warm
the insulation surface, thus leading to a reduced likelihood of surface condensation. The influence of wind speed on surface condensation is fairly large but reaches diminishing returns above the 5-7 mph range. Table 3 shows the influence of wind speed on the insulation thickness required to prevent condensation for several scenarios. As Table 3 shows, the required insulation thickness increases at lower wind speeds and is especially high at zero wind speed.

table-3-jy-surfacecond

When considering the influence of wind speed, remember that 0 mph is also a speed, and in most indoor applications, the wind speed will indeed be zero. In outdoor applications, it is typical to assume the presence of some wind when designing an insulation system. A commonly assumed wind speed in the industry, when there is not a specific reason to use a higher or lower value, is 7 mph.

Now that we have discussed the climatic design conditions, the next category of factors to examine is the system components and their influence on surface condensation.

Influence of System Components

Jacket TypeEmittance (Ɛ)

Emittance is an important factor in the radiative component of heat transfer and is defined in ASTM C168 as, “The ratio of the radiant flux emitted by a specimen to that emitted by a blackbody at the same temperature and under the same conditions.”

This is certainly not as simple to understand as wind speed or ambient temperature. Emittance ranges from 0 to 1, with lower values representing materials that have a comparatively low ability to transfer heat through radiation (such as aluminum or stainless steel metal jacketing) and higher values representing materials that have a greater ability to transfer heat through radiation (such as plastic, paper, and other non-metallic
surfaces).

It is important to note that emittance is not the same as solar reflectance. In solar reflectance, the color of the jacketing is important. A black-colored, plastic jacket would have a much lower solar reflectance than a white jacket and would, therefore, absorb more heat from the incident sunlight. In emittance, the color of the jacket has a minimal
influence. A black, plastic jacket might have an emittance of 0.92, while a white, plastic jacket might have an emittance of 0.90, which is an insignificant difference.

Table 4 shows the influence of jacket emittance on the likelihood of surface condensation. Jacket materials with lower emittance, like most metals, yield a colder outer surface, making surface condensation more likely and increasing the required insulation thickness. Materials with higher emittance, like paper, plastic, or mastic, yield a warmer outer surface, making surface condensation less likely. This has a significant effect on the insulation thickness needed to prevent the condensation from occurring.

PVC jacketing is not typically recommended for outdoor use, due to sensitivity to ultraviolet light, and is included in Table 4 to illustrate the impact of using jacketing with high emittance on insulation thickness. The use of painted metal jacketing in outdoor applications is an often overlooked, but is a good way to reduce the required insulation thickness by raising the jacket emittance.

Insulation TypeThermal Conductivity

The insulating ability of the insulation material used has a significant impact on the likelihood of surface condensation and the insulation thickness necessary to prevent this
condensation. There are many ways to characterize insulating ability. The most common in the North American mechanical insulation industry is the thermal conductivity (k-Factor) at 75°F mean temperature. This simple characterization is useful when discussing insulation materials but should not be used in calculating actual thickness or other heat transfer calculations. The often complicated relationship of thermal conductivity to mean temperature requires that any heat transfer calculations should be completed using this actual and full curve, not a single-point representation of this curve, such as the 75°F value. When comparing the k-Factor, note that a lower value is better. Table 5 shows the k-Factor of several mechanical insulation types at 75°F mean temperature, which is taken from the respective ASTM material standards.

table-5-jy-surfacecond

Of course, there are many properties besides k-Factor that should be considered when selecting an insulation material, including cost, water resistance, flammability, availability, and more. Nonetheless, the insulation material used, and its thermal conductivity, has a direct, strong impact on the thickness required to prevent surface condensation and must be considered when selecting an insulation material and determining insulation thickness.

Table 6 shows the strong influence of the insulation thermal conductivity on the insulation thickness needed to prevent surface condensation. As the thermal conductivity goes down (gets better), the required insulation thickness also decreases.

table-6-jy-surfacecond

System GeometryPipe Size and Flat Surface Orientation

The last factor to be discussed is the geometry of the system, meaning the NPS for pipe scenarios and the orientation of the surface for flat tank or duct scenarios. The cold flat
surface can be vertically oriented; horizontal, facing downward; or horizontal, facing upward. The influence of the flat surface orientation is a phenomenon that is often overlooked, leading to the mistake where all surfaces of a tank or duct are insulated with the same thickness. In reality, the convective component of heat transfer is different in each of these orientations, thus requiring different insulation thicknesses for each orientation. The difference in convective heat transfer is caused by the cold-air-sinking and
hot-air-rising phenomena, coupled with the possible interference of this movement by the tank or duct. As an example, on the top of a tank or duct, the cold air next to the surface of the insulation system should naturally sink, but it is “trapped” by the presence of the duct and insulation system below it. This causes the cold air to stay longer than usual at the insulation system surface, which leads to a colder insulation system surface and a greater tendency for condensation on this surface. To account for this, the insulation thickness on that top surface must be increased.

Table 7 shows the influence of pipe size and flat surface orientation on the insulation thickness required to prevent condensation. As the pipe size (NPS) increases, the insulation thickness required also increases. This effect grows in significance at colder pipe temperatures. The insulation thickness required on cold, flat surfaces is greatest on the top of a tank/duct, lowest on the bottom, and intermediate on the sides.

table-7-jy-surfacecond

Summary of the Influence of the Various Factors

The influence of all the factors on insulation thickness is summarized in Table 8, which also shows a qualitative assessment of the magnitude or size of the effect of each factor.

table-8-jy-surfacecond

Another way of summarizing the influences is to categorize the factors as either helpful—they reduce the likelihood of condensation or reduce the insulation thickness required to prevent condensation—or harmful—they increase the likelihood of condensation or increase the insulation thickness required to prevent condensation. This is shown in Figure 3.

figure-3-jy-surfacecond

When examining the impact of a design condition, the size of this effect must also be considered. For example, more care should be taken in considering r.h. than in ambient temperature, due to the former having a much larger effect.

 References:

  • J. Young, “Preventing Corrosion on the Interior Surface of Metal Jacketing,” Insulation Outlook, November, 2011.
  • ASHRAE 2009 Handbook of Fundamentals, Chapter 23, p. 3.

Note: This article is based on Jim Young’s presentation at the
NIA’s 57th Annual Convention. He will also be presenting this
information at the RETA National Conference & Heavy Equipment show on
November 6-9, 2012. Information about this presentation can be found at
www.reta.com/convention/2012/index.html.
© Copyright ITW Insulation Systems
2011.

Polyurethane

Polyurethane
insulation, commonly called PUR, is a closed-cell foam insulation material. It
is typically either spray applied or poured in place. Spray Applied
Polyurethane Foam (SPF) requires specialized equipment to apply the material
and proper technical training to get the best results. SPF is used in a wide
variety of applications, including industrial applications such as pipes,
tanks, cold storage facilities, freezers, and walk-in coolers.

ASTM
C 1029 Standard Specification for Spray-Applied Rigid Cellular Polyurethane
Thermal Insulation covers the types and physical properties for using thermal
insulation between -22°F and 225°F. The standard classifies materials into four
types by compressive strength, as follows in the chart below.

The
standard covers requirements for thermal resistance of 1.0 inch thickness,
compressive strength, water vapor permeability, water absorption, tensile
strength, response to thermal and humid aging, and closed-cell
content. For comparison purposes, the maximum thermal conductivity for all
types is 0.16 Btu-in/(h ft²°F).

ASTM
C 945 Standard Practice for Design Considerations and Spray Application of a Rigid
Cellular Polyurethane Insulation System on Outdoor Service Vessels covers
substrate preparation, priming, selection of the polyurethane system, and
selection of the protective covering for outdoor service. The Spray
Polyurethane Foam Alliance (www.sprayfoam.org) is a trade organization
of SPF producers and contractors who can provide additional assistance on SPF.

Polyurethane
foam is also available as one- or two-component poured-in-place systems in
disposable containers.

Figure 1