Category Archives: Global

With unemployment in design and construction reaching
over 20% in the last couple of years, skilled worker shortages may seem like
the last issue that the construction industry needs to worry about. However,
the demographics of an aging workforce, combined with the loss of workers
during the recession and the greater demand for workers expected as the economy
recovers, require the industry to consider whether the new worker pipeline is
sufficient. In addition, rising trends that require workers with
non-traditional skills, such as collaboration and green building, raise the
question of whether there are enough workers with the experience and skills necessary,
as these trends become more integral to the industry.

In response to these concerns, McGraw-Hill Construction
recently conducted research on workforce shortages and green jobs. The survey
results have been published in the Construction Industry Workforce
Shortages: Role of Certification, Training and Green Jobs in the Filling the
Gaps SmartMarket Report.
The report reveals that workforce shortages are
expected. It also demonstrates that more than one third of the industry has a
green job, and that the green building market, and the jobs associated with it,
will continue to grow at a strong pace. In addition, the study provides insight
into the role of certification in helping both workers and companies to succeed
to meet these new realities.

Skilled-Worker
Shortages

By 2015, McGraw-Hill Construction forecasts that
nonresidential construction will grow to be 73% higher than 2011 levels. While
it is important to remember that the 2011 levels of new construction starts
were very low, sustained levels of low activity over the past several years
have increased the number of workers who have left design and construction to
work in other fields. In fact, 58% of a representative sample of architects,
engineers, general contractors, and specialty trade contractors are concerned
about the loss of experience and skills due to workers leaving the industry
because of the recession.

Construction, like many other industries, also has a
significant number of baby boomers who are now approaching retirement age. 60%
of the survey respondents are concerned about the resulting loss of knowledge
as these workers retire.

In a separate, but related, survey of practicing architects
and architectural students conducted by McGraw-Hill Construction for the
American Institute of Architects (AIA), 79% of practicing architects who expect
a shortage are unsure whether the student pipeline will be sufficient to fill
the gaps. In addition, 78% of architecture students and recent graduates
express interest in working abroad, with over half motivated by the perception
that more work is available outside the United States.

Thus, even with the recovery just gaining momentum, 69% of
A/E and general contractor respondents expect some skilled worker shortages,
either among architects, general contractors, or specialty trade contractors,
by 2014.

Green Jobs and
the Green Building Market

In
addition to the results, the new report provides a construction
industry-specific definition of green jobs. McGraw-Hill Construction defines
green jobs as those involving more than 50% of work on green projects, or jobs
that involve designing and installing uniquely green systems. Green projects
are defined by McGraw-Hill Construction as projects that adhere to LEED or
other credible green building certification programs, projects that are energy
and water-efficient, and projects that address indoor air quality and/or
resource efficiency. Focusing on construction professions exclusively, these
definitions excludes support; administrative professionals; and manufacturing,
production, or transportation-related personnel. These definitions allows the
study to determine the level of green jobs in the industry based on direct
industry feedback.

In 2011, McGraw-Hill Construction estimated that green
building accounted for 41% of the total non-residential construction market.
This strong positioning of green projects in the marketplace is also reflected
in the number of green jobs; the survey reveals that green jobs account for 35%
of all the jobs in non-residential construction, representing nearly 650,000
jobs. Both green projects and green jobs are also expected to increase their
share of the overall market, with green projects accounting for nearly half
(48%) of the total market by 2015 and 45% of workers by 2014.

This dramatic growth has significant implications for the
availability of skilled workers necessary for these green jobs. In fact, even
now, the industry finds it challenging to find green, skilled workers, with
most of the respondents reporting that they have difficulty hiring green,
skilled employees:

  • 86% of A/E firms find it
    difficult to find skilled workers with green project experience

  • 91% of general contractors find
    it difficult to find skilled workers with green project experience

Benefits
of Certification

One
avenue for the industry to address these concerns about skilled worker
shortages is through professional certification/accreditation. All respondents
recognize the business benefits of having certified employees on staff:

  • 71% find that having certified
    employees increases their competitiveness and their ability to win contracts.

  • 68% find that having
    green-certified employees allows them to expand their green business.

With the strong business benefits that
certification offers firms, it is not surprising that 75% of the respondents
find that certified workers have more job opportunities. Other benefits that
certified workers experience include valuable knowledge, better compensation,
and greater opportunities for advancement.

For more information on green jobs, skilled worker shortages,
and certification, download the Construction Industry Workforce Shortages:
Role of Certification, Training and Green Jobs in the Filling the Gaps
SmartMarket Report.
The report is available for free at analyticsstore.construction.com/index.php/smartmarket-report-construction-industry-workforce-shortages-2012.html.
For additional insights into the construction market in general, please visit http://analyticsstore.construction.com/index.php/.


Recently, the mechanical insulation industry developed new tools to help show the direct benefits of mechanical insulation to the end user. In particular, the development and release of the Mechanical Insulation Design Guide’s Simple Calculators has the potential to greatly help the construction industry calculate and share the immediate Return on Investment (ROI) for properly installing or maintaining mechanical insulation.

However, like any other new advancement, the basis for success is how well the new tool can be shared and utilized across the industry. During a Merit Committee meeting at a recent National Insulation Association (NIA) Annual Convention, the committee members discussed how to spread the word of these valuable tools across our industry.

We feel that these Simple Calculators should be shared and used by insulation contractors, distributors, engineers, facility maintenance personnel, college and university academia, and even cost accountants.

Yet, the question comes to this: How do we share these tools? The answer is simple. We, the members of NIA, need to use these tools and share the knowledge of the benefits with not only our own membership, but to the greater industry and world as well.

So, as an insulation contractor, I started a campaign of educating whoever would listen about the impact of the proper and appropriate installation of mechanical insulation on the energy use and cost for any facility, no matter how large or small. The core theme for every single presentation I make to an engineer, facility owner, or even CFO is this: Mechanical insulation is an investment not an expense! It has a real and definable Return on Investment and I can prove it!

Here is an example of how using the Simple Calculators can show decision makers that properly installed mechanical insulation is an investment that more than pays for itself. In early 2011, my company was asked to provide pricing to insulate piping and equipment at a Veterans Administration Medical Center in southern Florida. Due to the small size of the
project, our calculations were less complicated, which made it easier to explain the cost savings to the client.

Our first task was to do a field take-off, which involves taking pictures, and measuring the temperature of the uninsulated piping and equipment.

After we completed our field take-off and prepared an estimate for each system and piece of equipment, we asked the customer for the type of fuel used and the approximate cost of that fuel.

Now, we had all the information we needed to prepare an estimate of the energy and financial savings for our customer. All that was left to do was input the data into the Mechanical Insulation Design Guide’s Simple Calculators. For our application, we used the
Energy Calculator for Horizontal Piping located at www.wbdg.org/design/midg_design_echp.php and the Energy Calculator for Equipment (Vertical Flat Services) located at www.wbdg.org/design/midg_design_ece.php.

For each pipe size, we entered all the data and printed out the calculator’s findings. Then we repeated the process for each tank.

Here is an example of the input information we gathered for one piece of pipe:

  1. Length of pipe run (ft.)100 ft.

  2. Select Pipe Size, NPS (in.) 1½ in. pipe

  3. Operating Temperature (ºF) 275 ºF

  4. Ambient Temperature (ºF) 85 ºF

  5. Wind Speed (mph)8 mph

  6. Select Insulation Fiberglass (0º F to 450º F)

  7. Installed Cost Multiplier .70

  8. Emittance of Surface 0.90 All Service Jacket

  9. Expected Useful Life of  Insulation System (years) 15 years

  10. Operating Hours per Year 8,760

  11. Efficiency of Fuel Conversion (%) 80%

  12. Select Fuel Fuel Oil

  13. Cost of Fuel ($/gal) $2.75/gal

As you can see, the facts sell themselves. By increasing the thickness of the insulation, the customer receives incredible savings on fuel. As a result, the customer elected to use 2-inch-thick insulation; and, on the one item above alone, is saving over $13,000 a year in fuel costs. These figures are based on early 2011 fuel costs; and since the price of fuel has risen significantly since then, our customer is enjoying even greater savings now.

Our calculations determined that the insulation for the entire project would pay for itself in less than three months and save the hospital $30,000 per year in fuel costs!

Our original estimate submitted to the hospital did not include this ROI data. After a few weeks, when we had not received the purchase order, we added the ROI data and re-submitted the estimate to the hospital engineer, and asked that he share it with his CFO. Amazingly, we received the purchase order within four days!

In this example, the Simple Calculators allowed us to easily and accurately determine the immediate and long-term cost benefits of installing mechanical insulation, and communicate those cost savings to our customer. Ultimately, using these tools resulted in  new business.

However, these calculators are not just useful for insulation contractors; anyone interested in reducing costs can benefit from using them. Insulation contractors, distributors, engineers, maintenance personnel, and managers can use the Simple Calculators to quickly and accurately determine the potential energy and financial savings of properly installing or maintaining mechanical insulation.

Here’s how: Look for uninsulated or under-insulated piping, vessels, or equipment. Conduct an evaluation of the equipment that includes temperature measurements during the take-off, and then use the Simple Calculators to determine the results.

Whether you are an insulation contractor competing for a bid or a facility owner trying to reduce energy costs, the Simple Calculators will help you to achieve your goals. And by sharing the benefits of mechanical insulation you’re also promoting the mechanical insulation industry as a whole, thus reinforcing the message that mechanical insulation is not an expense, but possibly your best investment.


On March 12, 2012, Richard E. Fairfax, the Deputy Assistant
Secretary for OSHA, issued “OSHA’s Memorandum on Employer Incentive and
Disincentive Policies and Practices” to all regional Administrators and
Whistleblower Program Managers. This memo identifies OSHA discrimination 11(c)
violations to a level that many employers may not have anticipated.

Most employers have been aware for years of the
whistleblower protection afforded to employees who make a complaint to their
employer or to OSHA regarding safety hazards in their workplace. This
protection is afforded to all employees under Section 11(c) of the Occupational
Safety and Health Act (OSH). That section states the following:

“No person shall discharge
or in any manner discriminate against any employee because such employee has
filed or instituted or caused to be instituted any proceeding under or related
to this Act or has testified or is about to testify in any such proceeding or
because of the exercise by such employee on behalf of himself or others of any
right afforded by the Act.”

What many may not realize is
that OSHA has developed a regulation under 29 CFR 1904.36 that extends the
protection of Section 11(c) to employees reporting a work-related fatality,
injury, or illness. Title 29 CFR 1904.36 states the following:

“Section 11(c) of the Act prohibits you from
discriminating against an employee for reporting a work-related fatality,
injury or illness. That provision of the Act also protects the employee who
files a safety and health complaint, asks for access to the Part 1904 records,
or otherwise exercises any rights afforded by the OSH Act.”

While most states have
workers’ compensation laws that prohibit discrimination against any employee
who files or testifies in a workers’ compensation claim, it appears that OSHA
is wary of employer misconduct when it identified an area in which it perceives
employees are without protection
.

For several years, OSHA has enforced
discrimination complaints brought by employees who have felt that they were
discriminated against because they reported a workplace safety violation. Mr.
Fairfax’s memorandum serves to highlight and explain the issue further. The
memorandum outlines four actions by employers that might have the potential of
being discriminatory.

The first paragraph of the four-paragraph memo
addresses situations when employers have policies that require disciplinary
action against employees who are injured on the job, regardless of the
circumstances surrounding the injury.

“Reporting an injury is always a protected
activity. OSHA views discipline imposed under such a policy against an employee
who reports an injury as a direct violation of section 11(c) or [Federal
Railroad Safety Act] FRSA.”

It is unclear how Mr.
Fairfax came to that conclusion. It appears that Mr. Fairfax is relying on the
language in 1904.35(b), which encourages employers to develop methods for
employees to report work injuries, and 1904.36, which purports to protect
employees from discrimination when reporting a work injury, to support his
proposition. In other words, since employers are supposed to encourage and even
require employees to report work injuries, employers will not be permitted to
use such a report to discriminate against them.

This change creates a problem for employers who
have a policy that may result in the termination of an employee who has too
many injuries. This policy is based on the rationale that such an employee is
obviously not complying with job safety rules; if he/she were complying, he/she
would not suffer as many injuries. Such a policy may be defensible, but such a
defense could be costly. After all, no employer can watch every employee all
the time, so injuries may occur with no witnesses to assist in establishing the
cause of the injury. As a result of this change, it is unclear if employers
will continue to be allowed to terminate employees who are injured too many
times, even if it is a result of a failure to follow the safety rules. However,
making such repeated injuries part of your safety enforcement program may still
be possible, if the program is created and administered carefully with all
efforts being made to treat the employee fairly and protect his/her rights.

The second and third paragraphs in the memo are
somewhat similar to each other. In paragraph two, Mr. Fairfax discusses the
scenario of when an employee reports an injury and is disciplined by the
employer because he/she failed to report the incident in the time or manner
that the employer specified. Mr. Fairfax states that this scenario deserves
further scrutiny because there is potential for violating section 11(c) or the
FRSA.

“OSHA recognizes that employers have a legitimate
interest in establishing procedures for receiving and responding to reports of
injuries. To be consistent with the statute, however, such procedures must be
reasonable and may not unduly burden the employee’s right and ability to
report.”

This statement
may create obstacles for employers because many employers, to comply with
1904.35(b), have set up procedures for reporting injuries and illnesses, and
automatically challenge any report that does not follow the established
procedure. It is possible that Mr. Fairfax’s memorandum may challenge those
policies. For example, an employer may no longer be able to consider a six
week, or a six month, delay in reporting an injury suspicious and as grounds
for denying the employee’s workers’ comp claim. Additionally, Mr. Fairfax did
not define the “discipline” enforced by an employer, which could lead to
further confusion for employers. Will employers be challenged by OSHA and
forced to undergo an OSHA discrimination investigation because they treat
claims that are filed incorrectly differently than those filed in the correct
manner?

The third paragraph also involves disciplining an
employee for violating safety rules. In this scenario, Mr. Fairfax explains
that he supports enforcing safety rules, but he is wary of employers unfairly
using the failure to abide by safety rules as a justification for disciplining
an employee after he/she has been injured. The memo seeks to ensure that
employees are disciplined consistently for failing to abide by safety rules,
even when no injuries have occurred. Mr. Fairfax also discusses vaguely-worded
safety rules, such as a requirement that employees “maintain situational
awareness.” Mr. Fairfax asserts that these types of safety rules can be used by
employers, in the result of an accident, to unfairly discipline employees who
report an injury.

In both the second and third paragraphs, the memo
implies that the employer may use the rule violation as a pretext for taking
action against the employee. In both cases, he states that such conduct by the
employer will be the subject of review by OSHA, with scrutiny being given to
how the employer applies the rule in situations where violations occurred
without any injuries. He also indicates that vague rules will be “carefully”
investigated.

In his last paragraph, Mr.
Fairfax touches on a practice more employers are embracing as a means to
encourage compliance with the company safety rules?incentives. For a few years,
OSHA has been discussing different types of incentive programs. OSHA has fairly
consistently criticized incentive programs that use recordable injuries,
lost-time injuries, or injuries in general as the cornerstone to incentivize
employees. In fact, several years ago, OSHA’s concerns with such incentive
programs were addressed in the failed ergonomics standard. But, in his
memorandum, Mr. Fairfax suggests that incentive programs that are linked to the
elimination or reporting of injuries may also be considered potentially
discriminatory conduct.

“Incentive programs that discourage employees
from reporting their injuries are problematic because, under section 11(c), an
employer may not ?in any manner discriminate’ against an employee because the
employee exercises a protected right, such as the right to report an injury.”

“If an employee of a firm with a safety incentive
program reports an injury, the employee, or the employee’s entire work group,
will be disqualified from receiving the incentive, which could be considered
unlawful discrimination.”

The implication to these statements is that if
you fail to award an incentive to an employee or his/her work group because
he/she reports an injury, you are engaging in unlawful discrimination.

So, now you may need to be concerned that if you
use an injury report-based incentive program, you may generate an OSHA
discrimination investigation if an employee or a group of employees is denied
an incentive because one of them reported an injury.

I have counseled against such incentive programs
in the past, but not due to the potential for discrimination. My concern is
that such a program could, because of peer pressure, cause an employee to work
when injured, especially if the incentive is good enough.

Imagine for example, an
employer promises to award a team of employees a bomber jacket if there are no
OSHA recordable injuries for the first half of the year. One employee suffers a
recordable injury 30 days before the end of the time period but does not say
anything and works hurt for 30 days to ensure that everyone gets the jacket. After
the jackets are awarded, he/she reports the injury, which has gotten worse for
lack of treatment. So, everyone gets their jackets, and the employer has a
workers’ comp claim in which the costs have tripled because of the injured
employee’s actions. Now, according to the recent memorandum, in addition to
getting a more expensive workers’ comp claim, the employer might also have
engaged in discriminatory conduct. If you have an injury reporting-based
incentive program, you should give serious consideration to modifying it to a
program based on safety performance.

OSHA frequently talks about
the “chilling effect” an employer’s actions may have on an employee reporting
unsafe conditions in the workplace. Perhaps Mr. Fairfax should consider the
“chilling effect” his memo may have on employers in maintaining an effective
safety program. Recently, an administrative law judge upheld a willful
violation against an employer, finding that, among other things, the employer
did not have an effective disciplinary program (DeWitt Excavating, Inc. CCH
Paragraph 33,174). In another recent decision, a citation was upheld, in part,
because the employer did not discipline a transgressing supervisor (ComTran
Group, Inc.CCH Paragraph 33171). Both of these recent decisions may make it
more difficult for employers to implement safety protocol without of fear of
violating federal or state regulations.

As a result of this recent memo, employers will
have more challenges to face when developing effective and legal safety
programs. After a safety program is developed and communicated to all employees,
and after employees have demonstrated their knowledge of those rules, the best
tool the employer has left to achieve compliance with the program is consistent
enforcement.

Under these somewhat ambiguous guidelines, you
have just been given a new challenge to run a safe worksite or plant and to
make sure all employees are on board with your safety program. Some of the
things you need to do include the following:


1.   Be sure all of your
safety rules are specific and provide definite requirements.

2.   Be sure you
effectively communicate your safety rules to your employees.

3.   Be sure to ascertain
the knowledge of your employees of the safety rules on which they have been
trained.

4.   Be sure to have a
detailed, definite, and easily understood (by all employees) safety enforcement
program.

5.   Be sure your safety
program is enforced consistently; you cannot afford to make exceptions.

6.   Don’t shy away from issuing discipline when an
employee suffers an injury because he/she violated a safety rule.

7.   Before you issue discipline for any safety
violation, be sure you have done a thorough and effective investigation.

8.   Be sure the reasons
for issuing discipline following an injury are consistent with your enforcement
program.

9. Be sure to document
the circumstances leading to the discipline.

10. Retain all disciplinary records so they are
available to demonstrate that you are consistently enforcing your safety
program in both accident and non-accident situations.

11. Don’t be afraid to
discipline, but be sure you can demonstrate that any discipline is for a
legitimate violation of company work rules.


Notes

To view the memorandum in full: http://www.osha.gov/as/opa/whistleblowermemo.html.

“Employer Safety Incentive and Disincentive Policies and
Practices,” last modified March 12, 2012.


The National Insulation
Association (NIA) announced the 2011 Theodore H. Brodie Distinguished Safety
Award winners at NIA’s 57th Annual Convention. This year, because of the large
number of award recipients, we judged applicants in two categories: Contractors
and Distributors/ Fabricators.

The Brodie Safety
Award, first given in 2004, was created to honor top companies that are proactive
when it comes to implementing safe working practices. The judging focused on
each company’s safety program, method of communication and training, and safety
statement. Applicants/winners will receive feedback from the judges on how to
improve their safety program. Several of this year’s winners also applied in
2010 and have implemented the 2010 feedback they received from the judges to
improve their 2011 safety programs.

NIA recognizes
safety as a vital part of the mechanical insulation business. The Theodore H.
Brodie Distinguished Safety Award was named after Theodore H. Brodie, who
passed away in 2010, in recognition of his unceasing efforts to make safety a
priority of the industry. NIA would like to congratulate all the winners and
applaud their commitment to safety.


Contractors

These Contractors
received the 2011 Theodore H. Brodie Award at NIA’s 57th Annual Convention in
Scottsdale, Arizona, on April 19, 2012.
The Brodie Safety Award is the NIA’s top industry honor
for outstanding safety performance.


Platinum Contractor Winners:

E.J. Bartells, Renton, Washington

F&H Insulation, Inc.,  Kechi,
Kansas

Gribbins Insulation Co., Inc.,
Evansville, Indiana

hth Companies, Inc., Union, Missouri

L & C Insulation, Inc., La Crosse,
Wisconsin

Performance Contracting, Inc., Lenexa,
Kansas


Gold Contractor Winners:

Advanced Energy Solutions, LLC,
Parkersburg, West Virginia

Advanced Industrial Services,
Walbridge, Ohio

Advanced Specialty Contractors, LLC,
Aston, Pennsylvania

API, Inc., St. Paul, Minnesota

Atlantic
Contracting & Specialties, LLC, Franklin, Massachusetts

Cornerstone Services Group, LLC,
Kansas City, Missouri

Dover Insulation, Inc., Marion, North
Carolina

Hudson Bay Insulation Company,
Seattle, Washington

New England
Insulation Company Inc., Canton, Massachusetts

New States Contracting, LLC,
Sayreville, New Jersey

Summit Contracting, LLC, Salt Lake
City, Utah

Thermal Solutions ? Ohio, Inc.,
Proctorville, Ohio

Zampell Companies, Newburyport,
Massachusetts


Silver Contractor Winners:

ABMECH, Inc., West Homestead,
Pennsylvania

Basic Industries, Ltd., Corpus
Christi, Texas

Global-Therm, Goodman, Missouri

Scandvic Enterprises, Inc., Colorado
Springs, Colorado


Bronze Contractor Winners:

Brand Energy Solutions, LLC, Pasadena,
Texas

Building Specialties, Inc., Houston,
Texas

Insulating Services, Inc., Charlotte,
North Carolina

L.C. Insulations, Inc., Lititz,
Pennsylvania

Luse Thermal Technologies, Aurora,
Illinois

Nicholas Insulation Services, Inc., Mobile, Alabama


Distributors/Fabricators

These
Distributors/Fabricators received the 2011 Theodore H. Brodie Award at NIA’s
57th Annual Convention in Scottsdale, Arizona, on April 19, 2012.


Platinum Distributor/Fabricator Winners:

E.J. Bartells, Renton, Washington


Gold Distributor/Fabricator Winners:

Pacor, Inc., Bordentown, New Jersey


Silver Distributor/Fabricator Winners:

Insulation Fabricators, Inc., Hammond,
Indiana


Bronze Distributor/Fabricator Winners:

Distribution International S.W., Inc.,
Houston, Texas

Shook &
Fletcher Insulation Co., Birmingham, Alabama

Superior Plus Construction Products, Corp. (Winroc
SPI), Lancaster, PA

Many executives have wondered how they will ever be able to develop this murky concept, called social media, into a viable strategy that will help grow their businesses. Social media is not as complicated as you might think. Essentially, the term means sharing information, such as ideas, personal messages, videos, etc., with an online community, like your friends on Facebook or your peers on LinkedIn.

While social media can be a great asset to any company, it is not necessary (in fact, often it is counterproductive) to use every social media application you can get your hands on. The trick is to be selective. Pick and choose the applications that seem best for your business when you weigh the costs (both monetary and time) with the benefits.

Here is a list of the top five social media applications you should check out, if you haven’t used them already.

  1. Facebook (www.facebook.com)
    and Google+(plus.google.com)

    Both of these free applications allow your company to connect with individuals on a personal level and maintain a dialogue with current and potential customers and partners. These days, nearly everyone, from your 14-year-old son to your 75-year-old mother-in-law, has a Facebook account (and Google+ has also risen in popularity).

    In order to utilize these social networking websites, people need to “like” your company’s page. Just as you would ask people to subscribe to an e-mail list, you would ask people to “like” your Facebook page. While millions of people are on Facebook, you are only communicating with the ones who have found your page and decided to connect with you. Although this may restrict the number of people you can connect to, it also ensures that the people who receive your posts are interested in your message or company. The more people who “like” your page, the more visible your company will be, allowing you to foster relationships with customers and partners, thus generating new business. Facebook is used primarily for personal social interaction and business-to-consumer relationship building, rather than business-to-business interaction.

  2. Twitter (twitter.com)

    When the free Twitter application first gained popularity in 2008-09, many people wondered how one could successfully communicate with a limit of just 140 characters. As users have become more comfortable with the platform, it has become clear that Twitter can be extremely useful for sharing new products and services, upcoming events, and breaking news. Essentially, think of Twitter as a way to communicate headlines, with links to other websites to provide additional information.

    Twitter created a worldwide stir when Iranians used the application to instigate and organize national protests in 2009. Dubbed “Iran’s Twitter Revolution,” traditional media sources relied on Twitter posts to cover news of the national unrest because Iran had banned all traditional media from the country.

    In the marketing arena, many companies are launching Twitter campaigns, including the Emmy-winning “Old Spice Guy” campaign that combined commercials, Twitter, and YouTube. The Old Spice Guy solicited questions from fans on Twitter and then answered them in personal, short, humorous YouTube videos. According to the social media experts at Mashable, the “total upload views for the Old Spice YouTube videos (including both the TV and the social media campaigns) [stands] at almost 135 million.”

  3. LinkedIn (www.linkedin.com)

    This is the only popular social media application that is designed specifically with businesses and professionals in mind. LinkedIn is a free website that helps you to foster relationships with peers, interact directly with clients, and find and recruit talented employees. This program allows you to create a user profile and develop strategic “connections” with other professionals. LinkedIn provides many great resources, including allowing you to create a forum to interact directly with your “linked” customers to create a community, professional groups for problem solving and industry discussion, and recruiting resources. Like Facebook, LinkedIn is more effective the more people you are
    “connected” with; however, it focuses on both business-to-consumer and business-to-business interaction.

  4. YouTube (www.youtube.com)

    Since the mid-2000s, YouTube videos have surged in popularity, as the free service allows anyone to upload a video and share it with the world. YouTube can be a great resource for sharing educational and marketing videos about insulation products and systems; indeed, several insulation manufacturers have posted product and/or installation videos that you can link to on your website or send to your customers.
    In order to use YouTube effectively, it’s important to ensure that you have a high quality and pertinent video. YouTube can be combined with other social media, such as using Facebook and Twitter to advertise your videos.

  5. Google Alerts (www.google.com/alerts)

    This free Google feature is an easy way to help manage your reputation, find out about new industry developments, or get updates on business partners or even competitors. Google Alerts lets you run a continuous web search on any topic. As new results—such as web pages, newspaper articles or blogs—appear that match your initial search query, you will be sent an e-mail alerting you of the news. You can use Google Alerts to monitor anything on the web.

    For example, many insulation professionals use Google Alerts to perform the following:

    • Find out what is being said about
      their company
    • Monitor a developing news story
    • Keep up to date on a competitor
      or industry
    • Find out about new industry
      regulations
    • Monitor codes or pending legislation
      that affects the insulation industry

In case you are worried that this feature has the potential to clog your inbox with e-mails, fear not. With Google Alerts, you can specify the frequency of e-mails to receive updates on a as-it-happens, daily, or weekly basis.

Creating a Plan

As you start to develop your social media strategy, devote some time and energy to
careful planning. Consider your target audience, determine your goals (brand building, marketing products, strengthening customer relationships, etc.) and evaluate the best social media tools to reach them. For instance, if your goal is to stay informed of industry news, Google Alerts might be the right tool. If you want to market your company’s products, Twitter might be a better forum. After you have established your goals, determine the metrics you will use to evaluate progress and how you will define success.
 

Once you have determined this part of your strategy, designate a staff member (or members) to be responsible for implementing and maintaining your social media platforms and invest in a social media training program for those personnel. Choose staff members you trust to speak on your behalf, manage your marketing and branding, and protect your company’s reputation. Additionally, make sure that these staff members are knowledgeable of your company’s policies and have the authority to address the customer complaints or issues that might arise in these public forums. Your designated staff members will be representing your company on a global scale; thus, it is important that
their communications are professional and their responses improve your brand, rather than harm it. Think of your social media applications as a billboard advertisement for your company on the highway. How would it look if your company’s billboard contained a misspelling or grammatical mistake?

The next step is to make your social media strategy a priority. Create a flexible calendar addressing the topics and timeline of posts. Set reasonable and specific goals, e.g., write one Facebook post each morning or week. A social media plan is not something you develop and then forget about; it’s an ongoing effort. Overall, make sure your company supports staff and allows them the time needed to learn about social media and implement your plan successfully.

Social Media Management

You will probably choose to use more than one social media channel in your marketing strategy. Fortunately, there are a few tools that are designed specifically to help you manage your entire social media campaign from just one website. These time-saving tools are a great help to a small marketing team. When selecting a social media application, it’s important to select a program that includes all or most of your social media websites so that you’re not just adding another program to the list of websites you have to monitor.

  1. TweetDeck (www.tweetdeck.com)

    This free website manages Twitter and Facebook accounts.

  2. Hootsuite (hootsuite.com)

    This social media management program allows you to manage your Facebook, Google+, Twitter, LinkedIn, Foursquare, Ping.fm, WordPress, My Space, and Mixi accounts all from one website.  It also allows you to add customized applications, such as YouTube, Flickr, and Tumblr. Hootsuite has various paid levels that are affordable for small businesses.

  3. Hubspot (www.hubspot.com)

    This social media management program is more extensive, as it offers a complete marketing system for small businesses. It includes website management, blogging tools, lead nurturing, e-mail marketing/automation, inbound marketing analytics and other tools. Free trials are available, but it costs $100 a year for the basic program.

Conclusion:

One of the biggest perks of the “digital age” is that marketing your company does not have to cost a fortune. With a savvy and selective media strategy, you can utilize free (or inexpensive) social media applications to brand your company; foster relationships with current and potential clients; recruit talented personnel; and keep tabs on new developments in your field, your competitors’ activities, and your own reputation. Social media can serve as a reasonably inexpensive way to expand your company’s marketing reach, in addition to your existing traditional marketing strategies.

What is cloud computing? What can it do for me?

Being
“in the cloud” is the latest catchphrase in technology discussions, but the
term has many definitions. According to some, it refers to virtual servers that
allow users to access stored data via an Internet connection. Providing access
in this manner is frequently referred to as using cloud-based or web-based
services.

Others expand the cloud to include any application used
outside of a company’s firewall. As InfoWorld has noted, moving to the cloud
can mean anything from increasing data capacity without having to invest in
additional infrastructure to licensing new cloud-based software. This can be
further expanded to include the use of mobile devices such as smart phones
(e.g., Blackberry, and iPhone) or tablets (e.g., iPad).

Cloud computing
and the construction industry

But
how does this relate to the construction industry?

The construction industry balances back office
functions?billing, paying invoices, running financial reports, payroll,
planning logistics?with the physical presence needed on the job site or in a
client’s office. Today’s technological solutions must be able to serve users in
both work settings.

As a result, making mission-critical business applications
available remotely is a hot topic these days. Remote access allows staff to work
from any location without being tied to a specific physical location. With the
amount of consolidation, decentralization of offices, travel-based positions,
and project work being done in different regions of the country or even
internationally, being able to offer solid, remote-access technology to
employees is critical for a construction company’s success.

For many companies, solving this challenge means moving some
of its applications to the cloud.

One construction company, True Value
Homes (TVH), is able to give any employee with proper credentials access to
these applications through a secure, web-based environment. Before the move,
TVH was running operations on 17 sites; and employees could only work in the
office, so all papers needed to be brought into the central office for
processing and approval. Whereas TVH once had 100 personal computers for 100
employees, now 500 users can access its web-based applications.

“We want to make sure that our employees get the best out of
their workplace,” Arun Nehru, TVH’s director, said. “What we are telling
employees is that [wherever you need to work], the applications are available
from office, home or outside. They need not come to [the] office to work.”

Collaboration
between contractors, owners/clients

Leveraging
cloud-based services also extends beyond the workings of a single construction
company. As Constructech’s 2011 IT survey notes, “Today’s construction
professional also needs to be highly collaborative. The word ?team’ has taken
on a whole new meaning in the construction industry. Every team needs to obtain
a high level of transparency and accountability for the property owner.
Overall, construction companies will be more collaborative, using technology to
connect all project team members?from subs to general contractors to owners?in
one central location.”

Yet, it is highly unlikely that each of the project team
members utilizes the same back office business management applications. So, as
general contractors, subcontractors, and owners individually look to the web to
leverage its capabilities, it will be critical to look at ways that technology
can ensure the secure and timely exchange of project information between them.

Mobility

As
noted by Constructech’s 2011 IT survey, contractors will then take project
information “out to the jobsite with mobile devices as well as applying a host
of applications on these mobile devices.” As the survey reports, construction
companies are reporting from the field as well as “carrying out project
management, scheduling, punchlists, and time tracking tasks in the field
today.”

This is evidenced by the growing momentum in the use of
mobile technologies in the construction industry. Yet, the type of device
varies as much as the job sites do. According to the survey, “the smart phone
is still one of the most commonly used devices at the jobsite (81% of survey
respondents). Laptops (69%) and tablets (26%) also receive a significant
response.” Given the advances in and adoption of tablets such as Apple’s iPad
over the past few years, growth is anticipated in the use of the tablet in the
construction industry as well.

Given the fast moving area of mobility,
today’s business management solutions need to support the highly mobile
workforce of the construction industry today and into the future.

Leveraging
today’s technology for the future

Does
that mean that your construction company needs to scrap everything it’s using
today for new cloud-based applications? In today’s economy, many companies are
looking more towards extending the applications that they are using today into
the cloud, where it makes the most sense.


In recent months, the economy appears to be gaining some forward momentum. The job market continues to improve, housing inventories have edged down, and confidence in the recovery is cautiously growing.  After meager job growth in 2010, the economy gained 1.8 million jobs during 2011 (the vast majority from the private sector) and the unemployment rate, which seemed to be stuck above 9 percent, improved substantially by early 2012. While this last point is of paramount importance to the millions of Americans still looking for work, it is also important to President Obama’s
reelection prospects, as this key economic indicator is closely linked to approval ratings. Even though employment levels remain below their pre-recession peak, improvement in private sector employment is essential to the recovery. As more Americans return to work, households become increasingly optimistic. Spending has risen, especially on durable items like cars and appliances, as some of the pent-up demand that accrued during the previous 4 years is slowly being released. Sales of light vehicles rebounded, and retail sales have strengthened. Improving job growth and confidence will propel the recovery forward in the months ahead.

In contrast to other business cycle recoveries that were led by sharply rebounding consumer spending, income growth continues to be weak as the job market remains relatively slack. Average production worker wages grew by only 2.1 percent in 2011, the slowest annual gain since 2004. This will constrain consumer spending, as households continue to bolster their balance sheets. In addition, many market watchers believe the recession brought about a new frugality among American consumers. As with the generation that survived the Great Depression, there may be a cultural shift toward less consumption relative to the decades leading to the 2008 financial crisis. This shift in consumer behavior will offset, to some degree, the pent-up demand starting to unfold.

The housing market is finally starting to show signs of life after 6 years of declines. The multifamily segment (i.e., condos and apartments) revived in 2011 as foreclosures and tight lending conditions pushed many former homeowners and new entrants into the rental market. Existing home sales have risen from their lows. Inventories of new and existing homes available for sale are returning to a balanced position. However, a steady stream of foreclosures continues to put downward pressure on home prices. In early 2012, roughly a third of existing home sales were so-called distressed properties (foreclosures and short sales), which sell at steep discounts. At the end of 2011, nearly 23 percent of all mortgages were “underwater,” suggesting defaults and foreclosures will continue to be a part of the housing landscape. On the demand side, improvements in the job market are key. During the recession, household formation?the main driver in housing demand?slumped, as unemployed young people returned to their parents’ homes and families doubled and tripled up. As employment grows, demand for housing will increase. New homebuilding will occur in areas of the country not overbuilt during the boom years and where job growth is strongest.

The industrial sector recovery continues with industrial production up and capacity utilization tightening, though at the beginning of 2012, production climbed back only about three-quarters of its peak-to-trough decline. The Conference Board’s index of leading economic indicators points to continued gains in the months ahead. Inventories are balanced against sales through the supply chain and, according to the Institute for Supply Management, many manufacturers think their customers’ inventories are too low. Order books and unfilled orders continue to expand, suggesting a broadening pipeline of manufacturing activity. A lower dollar and increasingly competitive natural gas prices in the United States have helped U.S. exports.

Despite recent gains, however, the U.S. economy remains vulnerable to a number of risks. Europe is in recession, curbing demand for U.S. exports to that part of the world. That Greece may leave the Euro is no longer considered unimaginable, and financial markets are bracing for a Greek default. Fiscal and debt problems in Italy, Portugal, and Spain also are troubling. While U.S. banks are not as heavily exposed to European debt as they were to U.S. mortgaged back securities, a disorderly unwinding in Europe could trigger another global financial crisis. In China, meanwhile, manufacturing activity in the world’s second largest economy has slowed, and property prices are sliding following a government-funded building binge. A so-called hard landing for China, while unlikely, could destabilize the global economy. Recent gains in gasoline prices also are worrisome. Higher gasoline prices act like a tax, reducing households’ discretionary spending. Longer term, deficit spending and growing U.S. Government debt may weaken growth prospects. Inopportune tax and trade policies also could threaten to derail the recovery.

Another real concern is price inflation. When growth in money supply exceeds economic growth, inflation results, as too many dollars chase the goods and services available in the market. Following the financial crisis, actions by the Federal Reserve to prop up U.S. banks resulted in unprecedented excess reserves. As of early 2012, the economy remains weak. Beyond the run up in oil prices fueled by Iran’s nuclear ambitions, there remains little evidence of broad-based inflation. However, as the economy strengthens, the Federal Reserve must be ready and able to mop up the excess liquidity in the money supply. Higher price inflation, possibly triggered by sharply higher oil prices, could seriously dampen economic growth prospects.

As global oil markets absorb the increased geopolitical risk from events in the Middle East and threaten global economic stability, a not-so-quiet revolution is occurring much closer to home. Natural gas production in the United States is expanding as once ignored shale gas resources are developed. This has significant implications for large segments of the U.S. manufacturing base. Shale gas is not new. The technology known as hydraulic fracturing whereby water is pumped at high pressure to create fractures in gas-containing shale rock, allowing natural gas to be extracted, has existed for decades, but was not an economic option until recently. As U.S. natural gas markets tightened in the early 2000s, and Hurricanes Katrina and Rita in 2005 pushed natural gas prices to unforeseen highs, previously uneconomic methods for extracting natural gas from shale formations suddenly became economic. As learning-curve effects and scale economies came into play, the cost of extracting shale gas declined. The Energy Information Administration projects that natural gas production will increase by about 1 percent per year through 2035 as production from shale becomes a major supply of domestic energy.

As a result, the economics have changed significantly for a number of gas-intensive manufacturing industries, including chemicals, metals, paper, and glass. The chemical industry, in particular, is dependent on natural gas for fuel to generate the heat and pressure required to split and recombine molecules. It is also unique among industries in its use of natural gas and natural gas liquids such as ethane as feedstock for the materials it produces from ammonia-based fertilizer to ethylene, a building block molecule used in thousands of materials. A decade ago, there was little to no investment in this segment of the U.S. manufacturing base. The new economics of shale gas and natural gas liquids, however, has spurred a wave of announcements for new U.S. petrochemical capacity, as the competitiveness of U.S. petrochemicals based on natural gas feedstocks has increased. Estimates of as much as a 25-percent increase in U.S. ethylene capacity have been announced by major producers. Pipelines are being built to ship ethane from the Marcellus shale formation (in West Virginia, Pennsylvania, and Ohio) to petrochemical producers in the Gulf Coast and also to Canada for use in petrochemicals. Other gas-intensive manufacturers stand to benefit as well. A recent Price Waterhouse Coopers report suggests that lower feedstock and energy costs could save U.S. manufacturers $11.6 billion annually by 2025.1 This, combined with a lower dollar, has made U.S.-based manufacturers more competitive than they have been in decades, which bodes well for a long-lasting resurgence in U.S. manufacturing.

As abundant shale gas supplies in the U.S. bolster domestic manufacturers, the export potential looms large. Roughly a dozen applications are in various stages of review to build liquefaction capacity to export liquefied natural gas (LNG) to Europe and Asia, where prices are several multiples higher than in the United States. Following the tsunami-induced nuclear disaster at Fukushima in 2011, natural gas demand in Japan has soared. In Europe, many natural gas consumers are captive to Russian supply and likely would welcome new supplies from across the Atlantic. In all, domestic shale gas resources offer tremendous opportunity for businesses along the supply chain from well head to burner tip or LNG terminal.

In summary, despite the near-term risks, the consensus outlook for the U.S. economy is for continued moderate growth. Most indicators point to steady growth, though still constrained somewhat by the excesses of the last decade. As jobs become increasingly plentiful, incomes will grow and demand for goods and services will increase, which in turn will create more jobs. Barring a shock, 2012 may be the year that the economy finally reaches the “escape velocity” that Larry Summers (former director of the National Economic Council) looked for in 2010. In the years to come, the evolving expansion will be further driven by a revitalized U.S. manufacturing sector that capitalizes on domestic shale gas resources.


Figure 1
Figure 2
Figure 3

Economic analysis and the
30,000-foot view are valuable ways to assess the state of the mechanical
insulation industry, but for this issue, Insulation Outlook wanted to get the
perspective of those who work in the industry on a daily basis: National
Insulation Association Members.

The following interviews
will give you a glimpse into the challenges and changes they are seeing in the
industry, as well as what they expect to happen in the coming year.

The views represented here
span the different categories of NIA Members: commercial and industrial
insulation manufacturers, distributors, fabricators, and contractors. We think
you’ll find these perspectives valuable.

1. In your opinion, what is the current state of the
industry?

I think
that the industry is in a solid position to reduce energy costs, show savings,
and have an impact on the environment; so we should continue to grow in terms
of awareness and opportunities. Growth may be slower than what I would like to
anticipate, but steady. The industry still needs to work together more, and all
of our NIA Members need to be more involved. [Beyond the industry], I wish I
had more confidence in the current business environment in the United States.

2. What do you see happening in the insulation industry
over the next year?

I think
things will remain steady and constant, with some minimal growth. The economy
is still stalled for the most part?although sectors and certain markets are
showing some moderate growth?as we wait to see what happens in November. There
is significant opportunity for growth and energy independence, but the attitude
in Washington has to change. Our industry can be at the forefront in terms of responsibly
helping energy independence and energy cost reduction/savings moving forward,
but? the political environment in D.C. has to be more business friendly, and we
are not there or even close to being there.

3. What were your biggest challenges in 2011, and what do
you foresee as the main challenges in 2012?

Our
biggest challenges were maintaining margins while growing. We were able to
further diversify our offering, which was great, but the outside pressures
related to margins were a daily fight. Discipline was a key factor in our
success.?

For 2012, we will continue with our business plan and stay on
task and remain disciplined. The challenges will be the factors that we cannot
control, which are related to the government? like excessive taxation and
deficit spending.

4. What changes would you like to see in local, state, or
federal regulations or energy policies related to mechanical insulation in the
commercial and industrial markets?

[Changes related to] energy independence,
specifically:

1. Development of the Keystone Pipeline.

2. Development of further oil and gas opportunities in
Alaska.

3. Further off-shore drilling within U.S. waters.

4. Further research on alternative energy sources.

5. Nuclear plant development.

6. A 20-year plan for infrastructure has to be developed
across the country.

All of the above can be done responsibly and safely
for the environment. This will create jobs, help our industry grow and give our
industry the opportunity to participate in a meaningful way toward energy
independence. The oil industry can have a huge impact on our economy and
economic stability. We can have energy independence with a good environmental
policy.

Related to alternative energy solutions, we
need to spend the time to develop these options over time. It is very
concerning to watch the amount of waste that goes into research in the effort
to win the race to be first. Washington, D.C. needs to set up the proper
business climate and not attempt to be in the development business. The federal
and state governments need to set up a business environment that will allow
business to grow and become healthy so that research and development dollars
can be put back into business. In the current business environment of tax and
regulate, we are locked up.

5. What are the products or insulation systems of the
future? When can we expect to see them?

In a more business friendly climate, there would be
further energy development and then I truly believe that you would see our
manufacturers, both domestically and abroad, begin to develop and release new
products.

A major benefit is that we have products
currently available that can have an immediate impact on energy savings and the
environment.

6. What initiatives would you suggest the industry undertake
to promote the perception of mechanical insulation as an important energy
efficiency initiative?

We need to stay on the current track to eventually
get tax incentives in place for mechanical insulation. NIA has worked very hard
to position us for the future; unfortunately, we cannot control the political
environment. Patience and persistence is the key.

7. How can the industry better educate facility owners
about the advantages of proper and timely maintenance, as well as the risk of
not having an effective maintenance program?

We need our membership to take the tools and
information that are available and begin to sell again. Most of us are caught
in our daily routine, dealing with all of the details that require basic
business to be accomplished day in and day out. If every NIA Member would
present the benefits of mechanical insulation to three facilities per month, we
would be on our way. What I would stress is that you need to be on your game,
understand our products, and last of all have the right audience.

8. What potential events do you foresee over the next two
years in the construction industry?

There
will be demand for more environmentally friendly buildings. There are pockets
of interest now. Water conservation will move to the forefront. I believe that
the overall operating cost of a building and/or facility will come under severe
scrutiny ? to reduce cost and become much more efficient.

Modeling a plant or building before it’s built, or reviewing
it in terms of how it is to be maintained in the future, will also become much
more visible.

All of that said, if we don’t change the business environment
in the United States, we will fail in our efforts to reduce and conserve
energy. We will not be able to grow and develop as a country with excessive
taxation and continued deficit spending.

For more information, call
425-228-4111 or visit
www.ejbartells.com.


1. In your opinion, what is the current state of the
industry?

I can really only speak to the industrial market, and
we are seeing a slight decline after several years of solid performance and
steady growth. The decline should only be temporary, as the engineering firms
seem to be loaded with projects that will come on line in the next few years.
In the South and Southwest, we have not been impacted as much by the economic
downturn that some other parts of the county have. There are several power
plants that are in pre-construction or the early stages of construction, and
insulation will play a key part in the success of these plants. For the first
time in decades a new nuclear power plant is being built, and this, too, should
be good for the future of our industry. If lending institutions begin to loosen
up, the commercial market should begin to gain traction.

2. What do you see happening in the insulation industry
over the next year?

Hopefully, getting the tax initiatives program
passed. Realizing this is an election year, that may not happen; but we have to
keep trying and we will. We must continue to educate the end users on the value
of energy conservation and the role our industry plays. Recently, I went online
to a state energy center for studies website and nowhere on the site was
insulation mentioned. That tells me we may still be, as Ron King says, “the
forgotten industry”?although through NIA it is being promoted. Insulation has
to become a forethought rather than an afterthought.

3. What were your biggest challenges in 2011 and what do
you foresee as the main challenges in 2012?

It is not just a challenge for the upcoming year but
the future as a whole, and that is the demographic of our workforce. Insulation
is a wonderful field to work in and truly is a learned skill. Our craftsmen can
make a good living for themselves and their families. The most difficult part I
see is encouraging young people to come work in our industry and the
construction industry as well. Throughout the country, training programs are
available if they are ready to learn.

Another challenge is getting more of the
engineering firms, architectural firms and even the end users to think about
insulation during the pre-engineering and/or design process and perhaps get us
involved on the front end of projects. We have a wealth of knowledge that can
be beneficial in most cases. If they would seek input from us, we might be able
to assist in a better design and save them money.

4. How can the industry better educate facility owners
about the advantages of proper and timely maintenance, as well as the risk of
not having an effective maintenance program?

I think with the tools and information available
through NIA, many members are attempting to do this every day. This past fall
several NIA Members made a presentation to the National Association of State
Energy Officers (NASEO) at their annual convention on the role of insulation
with regard to energy conservation, and I believe it opened many of their eyes.
Rather than just talk about how insulation can affect energy efficiency, an
actual example was used where the savings were significant with a quick return
on investment. Additionally, when we discussed the reduction in greenhouse
gases, it really got their attention. We must continue to take advantage of
these types of opportunities to get in front of groups like NASEO to present
our message.

Facility owners are looking for ways reduce costs and we have
the products that can produce almost instantaneous results. Now when I speak to
facility owners, I use concrete examples of how proper insulation can save them
money and reduce their carbon footprint. Some are beginning to listen. Just
about every state in the country has a budget deficit and is looking for ways
to reduce expenses. We are on the cusp of helping them toward that endeavor.

For more information, call
225-343-0471 or visit
www.pentrincorp.com.


1. In your opinion, what is the current state of the
industry?

The state of the industry is good?not strong, but
good. Those of us in the insulation industry are encouraged by improvements in
the industrial sector, where some large construction and renovation projects
are starting. In the commercial sector, we are
seeing growth with smaller one- and two-story commercial projects.

Institutional
sectors like hospitals, schools and government projects remain a mainstay for
this industry. They helped us weather the recession. Serving these industries
well is very important for companies in our industry.

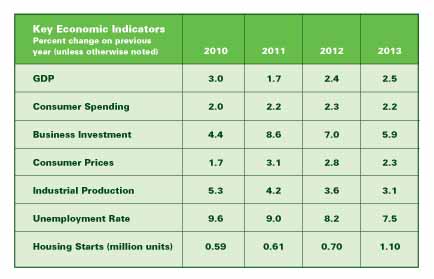
In the residential industry, housing starts
are slow but are expected to increase as 2012 progresses. When this market
increases, we will see growth of consumer confidence, which impacts all types
of businesses to a degree.

There is growth in the retrofit and
renovation side of our business. There’s a lot of uninsulated pipe and duct out
there. This represents a huge opportunity for the insulation industry.

2. What initiatives would you suggest the industry undertake
to promote the perception of mechanical insulation as an important energy
efficiency initiative?

Education is and always has been the key. We have to
continue to tell the story of how insulation is a great investment and how, in
many cases, it will pay for itself in months and not years. It is an investment
that pays greater dividends the more expensive energy becomes; and I don’t
think anyone expects energy?at least not petroleum-based energy?to become
cheaper long term. Our industry needs to champion energy efficient
construction. We have to remind our customers that energy efficiency doesn’t
happen without mechanical insulation! As energy costs go up, the savings from
installation of adequate insulation will pay back even quicker. It’s an easy
story to sell, and it bears repeating again and again.

Telling the story of the energy-saving benefits of insulation
will also help to reduce the instances of insulation being
“engineered out” of projects for the purpose of cost savings. As Building
Information Modeling (BIM) takes hold in the building community, engineers and
architects will continue to do more pre-construction analysis. This analysis in
the pre-construction phases holds the potential for validating insulation
products?perhaps even one day demonstrating to owners and engineers what the
exact value is. When that happens, engineers and owners will begin to see
insulation as a non-negotiable mechanical component.

For more information, call
919-304-3846 or visit
www.armacell.us.


1. In your opinion, what is the current state of the
industry?

Indications are that the economic downturn, which
started over three years ago, has just about run its course; and that activity
in the construction industry is beginning to grow. However, that growth is slow
at best.

2. What do you see happening in the insulation industry
over the next year?

As the economy grows, there should be more
opportunities for all insulation in the coming year. As the awareness of the
value of insulation increases, our industry should be in a favorable position
to expand at a more rapid pace than the general economy.

3. What were your biggest challenges in 2011 and what do
you foresee as the main challenges in 2012?

We had difficulty controlling healthcare costs in
2011 and we expect that to continue through 2012 and beyond as the new
healthcare legislation begins to take effect. Price increases in almost all of
our raw materials and finished goods expanded at a rate that was difficult to
keep up with. Our customers, especially contractors, were hard pressed to
estimate what material costs would be for jobs they were asked to quote. That
trend is continuing in 2012. The recent rise in fuel prices also will affect
us.

4. What changes would you like to see in local, state, or
federal regulations or energy policies related to mechanical insulation in the
commercial and industrial markets?

Anyone who listened to the State of the Union heard
the president use the word “insulation” when he was discussing energy savings.
That is a very positive sign. NIA has been in the forefront of the effort to
get energy legislation through Congress. There is a good story to be told about
the value of insulation, and we are telling it.

5. What are the products or insulation systems of the
future? When can we expect to see them?

While it is difficult to predict the future, there
have been several new products that have come to market in the past several
years: Aerogels and fiberglass with non-organic binders being two of them. I
would anticipate that this trend will continue.

6. What initiatives would you suggest the industry
undertake to promote the perception of mechanical insulation as an important
energy efficiency initiative?

As I drive to work each day, I pass several
billboards along the interstate highway extolling the virtues of insulation.
These ads are paid for by Local 17 of the Heat and Frost Insulators of Chicago.
I would not have guessed 5 years ago that I would be seeing this. We, along
with many others, are doing lunch-and-learn presentations to engineers and end
users and we are having an easier time getting past the gate keepers! These are
some of the things that we, as suppliers, are doing; and I know that the
contractors and manufacturers are engaged in similar activities.

7. What potential events do you foresee over the next two
years in the construction industry?

There has
been some consolidation in our industry, and I would expect that would
continue. We have been in an unsettled political climate for some time now, and
that will continue at least until the election in November.

For more information, call
800-775-4485 or visit
www.insulationfabricators.com.

Each
year our industry talks about the abundant opportunities for mechanical
insulation to make a difference in energy efficiency, in the “green” movement,
in helping our economy recover, in supporting our country’s effort for energy
independence and national security, and other areas of importance to all facets
of industry and government?and each year we nod our heads in agreement. We have
accomplished so much in the last 5 years, but mechanical insulation is still
like Rodney Dangerfield on the battle fields of energy efficiency and “green”
initiatives: We get no respect.

We humbly discuss our successes and we are well aware that
many factors and players are responsible for those achievements. Ralph Waldo
Emerson wrote, “There is no limit to what can be accomplished if it doesn’t
matter who gets the credit.” As an industry, we need to appreciate that there
is no limit to what we can accomplish if we band together to make a difference
for the common good and not worry about who gets the credit. We have made great
strides in our efforts to have mechanical insulation recognized and appreciated
for its value in the commercial and industrial segments, but the journey is
long and not always easy. It is time to change the rules of the game and
accelerate our efforts.

Our industry is small in comparison to many others, but our
impact on the nation’s economy on a dollar-for-dollar basis has to rank in the
upper percentile. Why does our contribution seem to be viewed as less
significant in Washington, D.C., in state capitals and by agencies, coalitions,
associations, and many in the engineering and construction communities? While
that question does not apply to every individual or situation, as an industry
veteran I am reminded daily that it applies to many more than some would like
to admit.

It is time for mechanical insulation?our industry?to have an
active seat at the tables of influence. It is time for all industry channel
participants to get involved. Individually, our voices are not always heard.
Together, they echoe off the walls of change and we accelerate in the race to
make a difference?a race that is less about crossing the finish line first than
about not being in the back of the pack. The danger of being left behind is
real and should not be ignored. 

Our industry needs to resolve to be recognized as a leader in
energy efficiency and other fields in which we participate and influence the
changing commercial and industrial construction environment. We need to
challenge the status quo.

Energy and Energy
Efficiency

Energy
is and will remain at the center of our economic future and around the world.
Energy independence, national security, climate change, and sustainable
development are all affected by energy. Advocates of increased use of
alternative energy sources increased production and use of nuclear and fossil
fuels; and a long list of similar initiatives seems to be in every publication.
Ultimately, probably all of the above needs to move forward at a faster pace
and scale.

Efficiency needs to be first on the list when it comes to
everyone’s discussion about our energy future. The End-Use Efficiency Working
Group noted in its 2003 report, “Efficiency can be a powerful tool in any
effort to accomplish sweeping changes in the use of fossil fuels, to make
industry more profitable, and to tame the emissions challenges of the 21st
century.” That applies to all energy sources and potentially is the easiest and
fastest goal to achieve, given the investment required for expansion or
creation of new facilities and technologies. However, we must realize that any
number of barriers prevent a high level of energy efficiency investments.

One such barrier is clearly evident in the maintenance of mechanical insulation. We have
heard many times, “common sense indicates you should replace or repair missing
or damaged insulation.” If that is the case, there is a tremendous lack of
common sense around. (Sorry, but it is true.)

NIA published two specific studies, among many others,
related to missing or damaged insulation.  Working with the Department of
Energy and Oak Ridge National Laboratories (May 2010), NIA and its partners
extrapolated the results of more than 1,100 assessments of large and medium
manufacturing facilities, which indicates that mechanical insulation could
deliver annually $3.7 billion in energy savings and reduction of 83.5 billion
lbs/yr of carbon emissions, with a return on investment in 13.1 months (95
percent annual return) and creating more than 27,500 sustainable jobs from
simple maintenance of mechanical insulation in industrial/manufacturing plants.

A mechanical insulation energy appraisal was conducted
(September 2010) on a variety of State of Montana facilities located in and
around Helena, Montana. The objective of the appraisal was to determine the
energy, cost and emission reduction opportunities available via the repair or
replacement?maintenance?of mechanical insulation systems in Montana’s state
facilities. The assessment addressed 56 mechanical rooms in 25 facilities.
Estimates indicate energy savings representing roughly 8 percent of the total
natural gas consumption of the facilities analyzed, with an annualized rate of
return of 24 percent.

Industry has been estimating for years that between 10 and 30
percent of all exposed mechanical insulation becomes damaged or missing within
1 to 3 years of installation. Over time, and depending on the operating
environment and exposure to the elements, that percentage is likely higher. With
the energy savings potential and the rate of return, the common sense truism
stated makes sense only if you employ common sense. Maybe the barrier is that
CEOs and CFOs, and others in the budget chain, need to employ a different
financial model. In the case of mechanical insulation maintenance, it is an
investment that delivers an acceptable rate of return or hurdle rate. It should
not be viewed as impairment to the short-term bottom line but as an enhancement
to the short- and long-term cost bottom line.

Education and
Awareness – the Best Way Forward

After
years of frustration related to realization that mechanical insulation is not
being recognized for its value in many arenas, I remain convinced the
fundamental problem is lack of sufficient and proper education and awareness as
to the design, installation and maintenance of mechanical insulation systems.

The need for basic and continuing education at the college,
university and trade school levels is a given. How to accomplish that
efficiently and cost effectively is the challenge. However, the magnitude of
the challenge should not be a deterrent to embracing the opportunity. If our
industry is going to fundamentally change how mechanical insulation is viewed,
education?at a minimum at the post high school level?must happen. Some would
argue the basics of thermal insulation education should begin at the grade
school level. The enormity of that challenge and opportunity goes far beyond
the scope of this article, however.

NIA has taken a leading role in the development of some great
educational tools that are free, generic by design, and available 24/7/365: the
Mechanical Insulation Design Guide (MIDG); the suite of simple calculators;
and, most recently, a series of
E-Learning modules. These tools were created to aid you in business and can
even help grow your sales. Has your company
taken the initiative to educate your employees about the value and use of these
tools and, more importantly, have you educated your customers?

The best marketing endorsement is word
of mouth. If industry participants are not using and encouraging others to
investigate and use the tools available within their own companies, and with
their direct and indirect customers, how can we expect meaningful industry
change to occur? It is the easiest, most cost-effective, and meaningful means
to influence change: educate your employees and encourage them to educate
others. You may be amazed. Improved employee and customer loyalty, increased
customer and market share, and product preference may result, all of which
translate to increased profitability.

The concept is similar to gossip, it just does not move as
fast. You tell 10 people, those people tell 10 people and so forth. Before long
you are educating a larger universe. If people hear continual information about
the value of mechanical insulation, you create behavior change and have
implemented one of the most effective marketing strategies?word of mouth and
endorsement.

Government
Initiatives – Support

We
are the only association solely focused on the mechanical insulation industry
and working for all its of participants?manufacturers, distributors,
laminators, fabricators, and contractors. Our industry is more visible than
ever on Capitol Hill. Just a few years ago we had no presence, and now we are
engaged on many fronts, including:

  • creating and passing tax
    incentives,

  • inclusion in multiple proposed
    omnibus energy bills,

  • working with agencies on
    specific objectives including educational programs,

  • membership on coalitions working
    for various legislative initiatives that would benefit the industry, and

  • looking for new appropriation
    opportunities.

We have accomplished a lot. It is not a bad record for
starting about 50 years behind; not having a full-time presence on the Hill,
millions of dollars to spend, or a Political Action Committee (PAC).

We have had several key successes on the Hill. For example,
in 2010 the $500,000 appropriation to the Department of Energy for initial work
on the Mechanical Insulation Education and Awareness Campaign, from which
multiple data-gathering projects were completed, the simple calculators were
improved and expanded, and the E-Learning modules developed; and introduction of the Mechanical Insulation Installation
Incentive Act of 2010 (MIA) and again in 2011 in both the House and Senate,
gaining support for potential inclusion in a future energy bill. We have
accomplished a lot in a relatively short period of time but we want more and,
as always, we want it now. To accomplish objectives in Washington, you need a
continual and active presence, funding and, above all, patience. Those
attributes are not something the industry is accustomed to. We should have
initiated these efforts many years ago. Hindsight is great, but it is the
lesson of hindsight that propels our industry to maintain and increase our
presence in Washington, D.C. and all state capitals.

MIA provides a tax incentive in the form of an additional tax
deduction for going beyond the levels established in ASHRAE 90.1 2007 in new
construction and retrofit applications, and for replacing missing or damaged
insulation in maintenance applications. It is designed to increase awareness of
mechanical insulation, similar to clipping coupons, and provide an extra
incentive to facility owners to increase their use of mechanical insulation to
save energy, increase profitability, help our environment and create jobs.
Nothing is wrong with that picture. All tax incentives cost money, though, and
generally the Joint Office of Taxation is asked to determine that cost?or, as
they call it, to score the bill. The score only looks at the cost, what they
refer to as static scoring. They do not consider the benefit or what is
referred to as dynamic scoring. With the current environment in Washington,
D.C. anything that costs money and potentially increases our country’s deficit
is headed for an uphill battle. When you personally invest in any energy
initiatives, do you only look at the cost without examining the long-term benefit
or the return? Of course not, but our government does. If the benefit of many
tax incentives were part of the equation, many may never pass and others would
pass immediately. Mechanical insulation is one of those that would be a shining
star on a fast track for adoption. If only common sense would prevail. You
don’t have to be frustrated over a lack of common sense. You can make things
happen.

You Can Make a
Difference

Do you want to influence potential long-term growth
opportunities or rely on others to do it for you? Do you believe the economy is
the sole driver of your business and nothing you can do will change that? Do
you want to differentiate yourself among your peers, or your company from your
competitors’, or do you want simply to rely on the events of the day? In short,
do you want to play in the game or stand on the sidelines?

Our industry has many sideline observers. Not everyone can
participate at the same level but not participating at any level is just not
acceptable. Participation and support do not have to be complex, time
consuming, require excessive expense or lead to robo-type calls for additional
participation. Participation is an investment that provides a return. The level
of investment is an individual choice, but by all means invest. The mechanical
insulation industry has proven to be a good long-term investment. In many
cases, it is the little things that matter. Here are a few examples:

  • ASHRAE 90.1 is the primary
    “standard” that is referred to in many specifications and/or codes. ASHRAE 90.1
    2010 provides for an increase in insulation thicknesses in most piping
    applications other than applications like chilled water. Do you understand the
    differences in the 2004, 2007 or 2010 editions? Have you educated your
    employees and your customers on the differences? Talking?educating others to
    implement those changes?will improve your business. No matter how you
    participate, assuming your margins are constant, your revenue would increase
    and your gross profit dollars would go up. Some have estimated it takes between
    3 to 5 years to implement these types of changes unless codes automatically
    change when the relative standard changes. That is the exception, not the rule.
    A building owner does not want to have a building behind current standards when
    completed, especially when those changes provide economic benefit, and the
    adoption of holistic energy building rating systems are on the horizon. Help
    drive adoption of ASHRAE 90.1 2010.

  • When pursuing legislative
    initiatives?federal or state?the voice that matters is yours?the voice of the
    constituent. A simple and timely letter or e-mail to your member of Congress or
    Senator can be the difference in obtaining that person’s support. That may
    sound overly simplistic, but in more cases than not a request from home is the
    deal maker. Whether you voted for the person or not, speaking up matters.

    Participation in this area
    could be extremely impactful. In most situations, a suggested draft
    communication document is provided for your review and use. It can simply be
    printed on your letterhead, easily personalized, signed and/or cut and pasted
    into an e-mail and sent. Timing is everything on this type of request. After
    meeting with Congressional Representatives or their staff, or when an event is
    about to occur, is when outreach efforts are of the most value. When the
    subject is fresh in their minds and is a “hot topic” is the time to act, not a
    week or month later.

  • In all industry channels,
    providing customer education and awareness of information and tools that can
    help them is of value to you and your company. Reach out to local association
    chapters of ASHRAE, ASME (founded as the American Society of Mechanical
    Engineers), Association of Energy Engineers (AEE), Refrigerating Engineers and
    Technicians Association (RETA) and others and ask to make a presentation at
    their chapter meetings. Show them the simple calculators, the E-Learning
    modules and new products or systems. You mingle with your direct and indirect
    customers and establish your company as the go-to entity while increasing their
    knowledge as to the value of mechanical insulation. There is no downside.

  • Support your employees and
    promote your customers’ participation in mechanical insulation webinars,
    podcasts and similar educational events. They are not expensive but provide an
    effective means of learning what is available and communicating the value of
    mechanical insulation.

  • Help
    with the development of case studies and data. Make no mistake, we are
    competing more with other industries than among ourselves. Our industry is
    starving for generic data on many fronts, including case studies that refer to
    actual events, projects, customers, benefits and applications. Many companies
    publish case studies that highlight their company and products and contain
    great information that is certainly of value in their marketing efforts.
    However, because they are not generic in nature, they are seldom promoted by
    others and end users/specifiers often view them with a jaundiced eye. Generic
    information developed by industry is looked upon differently. While many, if
    not most, competing industries have a wealth of information related to size,
    usage, patterns, geographical differences, comparisons and long list of other
    meaningful information, our industry struggles to come together for the
    development of similar data. Companies must have “super secret” information, or
    at least they believe they do, and fear that sharing data with a third-party
    source somehow would weaken their position and strengthen their competitor. For
    the good of our industry, we must find a way to overcome this barrier.

  • Support your association and its
    efforts. Membership and involvement, financial and personal, pays many
    dividends. You have a seat at the table to influence direction, change and
    strategic planning, and the opportunity for peer networking is invaluable. Some
    can and elect to contribute and participate more than others do. However, every
    voice has impact, regardless of the channel in which you participate, labor affiliation,
    company size, location or number of meetings attended.

The bottom line: Get involved; you can make a difference.
Your participation is needed and appreciated. Your impact may not be able to be
measured in dollars, but over time movement makes a difference. Industry
participants banning together with increased involvement is a movement, and it
will make a difference for the growth and prosperity of the industry today,
tomorrow and for future generations.

Opportunities and
Challenges Are Abundant

With
every opportunity there are challenges, and with every challenge there are
opportunities. The industry has an abundance of each. Some of the opportunities
and challenges of the future are:

  • As the development of holistic
    building measurements and codes continues to gain momentum, the industry?which
    has historically operated in a prescriptive environment?needs to address how to
    make prescriptive initiatives work in a holistic world.

  • Building simulation and energy
    modeling also are gaining momentum daily. Mechanical insulation needs to be
    specifically recognized in those endeavors. The industry may need to actively
    work with coalitions and similar groups that may be charting new ground and
    require data related to different building types.

  • We must become more involved and engaged on a continual basic with
    federal and state agencies to secure mechanical insulation’s place at the table
    with building and industrial initiatives that could impact the industry. As the
    political winds blow and continually change directions, that seat could be very
    important but one that will demand patience, flexibility and understanding.

  • To affect change, the industry’s
    education and awareness outreach initiatives must not only encompass the
    federal level but the state level. The human and financial resources to
    implement that effort are complex but ultimately essential to the success of
    the industry, especially within the changing business environment. Building
    coalitions and working with other industry associations, as well as commitment
    of our own association members at the state level, may hold the key to meeting
    short- and long-term goals in this area.

  • Developing data and related
    information as to mechanical insulation in the world of sustainability, the energy-water
    nexus, lifecycle analysis, the numerous and ever-growing “green” programs and
    similar types of initiatives is not an option but a requirement. The world is
    heading rapidly in those directions. While the potential of mechanical
    insulation’s contribution is great, it should not be taken for granted. Generic
    and industry-supported data/information is needed sooner than later.

  • The industry needs to fully
    embrace the reality that we are competing with many other initiatives for
    capital, maintenance, research, education and other resources in fields like
    energy efficiency, sustainability, modeling, stimulus programs, etc. Competing
    fields include controls, lighting, solar, wind, envelope applications, duct
    sealing, high-efficiency appliances and so forth. Each of these can negatively
    impact our industry if they are chosen over mechanical insulation. We need to
    understand and promote the mechanical insulation advantages over these
    competing initiatives.

There are so many areas of opportunity available they are too
numerous to list in this article. We should be defined by how we take advantage
of the opportunities rather than how we are stymied by the challenges. The
mechanical insulation industry for years has been dependent on the economy. In
reality, that dependency may always be the primary influence. Our industry
needs to accept and embrace whatever hand the economy deals us, but we can also
positively influence mechanical insulation’s role in that economy by simply
understanding and aggressively examining the changing marketplace and
addressing the opportunities where we can make a difference.

The Economy

You cannot talk about the State of the Industry without
discussing the economy. By no means can I predict where the fluctuating economy
is heading, nor would I pretend to know the answer. There are so many domestic
and global moving parts that even the so-called “experts” seem to regularly
change the forecast. There does seem to be some consensus, though, that
creating sustainable jobs is at the center of the answer.

Our industry was not unique in that we experienced a major,
27-percent (+/-) decline in 2009 from 2008.  2009 to 2010 saw a 5-percent
recovery, and I expect we will determine that we had a similar increase in 2011
over 2010. What will 2012 bring? I suspect we will continue to see a slow
recovery for the next several years in the 3- to 7-percent annual range. It is
hoped that increase will come from a reasonable combination of unit and dollar
growth. That said, so many factors are at play and the overall vulnerability of
the economy is such that that view could change by the time this article is
published. The primary question is: what is the long-term, sustainable growth
rate for industry in general, i.e. investor confidence?

A slow but solid and sustainable recovery is probably the
best scenario?likely a much slower recovery than we have experienced with
similar economic downturns. The industry is historically one of the last
sectors to feel the impact of a downturn and, unfortunately, one of the last to
reap the benefits of a recovery. The recovery cycle is even more visible when
the general economy is slow to recover and/or is continually hitting speed
bumps or taking undesirable turns.

With all of that, we will continue to see dramatic geographic
differences. Some areas and certainly individual companies may enjoy bursts of
recovery driven by project securement, mix of business among business segments,
product lines and an array of other unique or localized events.

Summary

There
is reason to be enthusiastic, passionate and opportunistic about the future of
the mechanical insulation industry, but the business/industry profile of the
future will not look like the profile of the past.

Our industry has responded to many past challenges and overcome
rough economic times, and we will again. We have proven our resiliency and
resolve time and time again. I continue to believe the NIA world is strong and
a good place to be, and the future will only strengthen the industry’s
foundation and secure the future for many generations to come. The
opportunities are there. We need to go after them, not wait for them to come to
us, and not be left behind in the changing business environment. Now is the
time for our industry to resolve to be heard, to influence and embrace changes
and not let others define our future. Together, let’s change the status quo.


Trying to determine what the future holds? These three construction reports may give you the insight you need to predict the future.

U.S. Demand for Insulation to Approach $9 Billion in 2016

U.S. demand for insulation is forecast to rise 7.8 percent annually to $8.9 billion in 2016.  Advances will be driven by a rebound in building construction expenditures from a depressed 2011 base.  Further growth will be spurred by changes in building codes and continuing consumer interest in reducing energy consumption and utility bills.  Home owners and building owners will add or upgrade insulation to achieve these goals. These and other trends are presented in Insulation, a new study from The Freedonia Group, Inc., a Cleveland-based industry market research firm.

The residential market will post the most rapid gains through 2016, advancing at a double-digit pace as housing starts rebound.  Moreover, builders will construct homes with larger amounts of insulation to make them more desirable to potential buyers. Residential insulation demand will also be supported by the attic reinsulation and home improvement and replacement markets.  Insulation demand in the nonresidential market will also see solid advances.  Rebounding nonresidential building construction expenditures, particularly in the office and commercial segments, will promote gains.

Fiberglass insulation accounted for the largest share of insulation demand in 2011, with 48 percent of the market by value. Fiberglass insulation will remain the market leader in 2016, with demand rising 8.1 percent annually to $4.4 billion.  Growth will be spurred by a rebound in the residential market.  Fiberglass insulation remains a popular choice with builders and contractors because of its low cost, favorable insulative properties and ready availability.

Demand for foamed plastic insulation, which accounted for the second-largest share of the market in 2011, is expected to rise 7.3 percent per year to $3.9 billion in 2016.  Advances will be driven by the rebound in building construction spending.  Demand for radiant barrier and reflective insulation is anticipated to grow 8.7 percent per year to $190 million in 2016.  The rebounding housing market will boost demand, with further gains supported by increases in industrial and nonresidential building construction spending.  Growth will be concentrated in the South and West regions, as structures in those regions are more often exposed to sunlight, and thus best benefit from the use of radiant barriers and reflective insulation.

Insulation (published 03/2012, 331 pages) is available for $5100 from The Freedonia Group, Inc. For more information, visit www.freedoniagroup.com.

FMI Releases Nonresidential Construction Index  (NRCI) for the First Quarter, 2012

Hiring Prospects and Construction-Put-in-Place Improve While Heavy Price Competition Continues

The NRCI gained 7.8 points over last quarter to 58.1 this quarter. This positive move to start the new year is not exactly the sign of a bull market for construction, but continuing confirmation that panelists believe that the construction activity is following the lead of the slowly improving economy. There are good signs in hiring plans for 2012, as well as construction-put-in-place predictions. However, panelists indicate that low project pricing and high competition are still driving the market place.

  • Hiring: A five percentage points increase over this time last year, 42 percent of panelists indicated a zero to five percent increase in full-time direct employees. Additionally, fewer panelists indicated a reduction in salaried employees.
  • Construction-Put-In-Place: Expectations for CPIP are positive but cautious, as 41.3 percent of panelists expect growth of 0.5 to 2.5 percent for 2012.
  • Overall Economy: The component for the overall economy showed the strongest improvement of all index components, with a jump from 43.6 last quarter to 68.7 in the first quarter, a 25-point gain. This score reflects the improvement in many economic indicators including the unemployment rate.
  • Nonresidential Building Construction Market Where Panelists Do Business: At just 54.9, the local markets for nonresidential construction are inching ahead. However, panelist responses reflect a perception that their own business is performing a bit better than the overall nonresidential construction market. This indicates that local markets are still very competitive.
  • Cost of Materials: Despite a slow economy, material costs continue to rise, with no panelists indicating material costs were lower than last quarter. The cost of materials component moved down nearly 5 points to 26.2. This factor is continuing drag on the overall index and is likely to raise the cost of projects while lowering profit margins for contractors.
  • Cost of Labor: The cost of labor improved just slightly to 41.5, indicating little change over the score of 40.0 last quarter. However, no panelists indicated they were experiencing lower labor costs.
  • Productivity: Contractors are continuing to make moderate gains in productivity. However, at 52.9, this component is still too weak to offset rising costs for labor and materials.

For more information, visit www.fminet.com.

February Construction Falls 7 Percent

At a seasonally adjusted annual rate of $376.0 billion, new construction starts in February dropped 7% from the previous month, according to Robert Murray’s monthly report for McGraw-Hill Construction, a division of The McGraw-Hill Companies. The nonbuilding construction sector, comprising of public works and electric utilities, lost considerable momentum in February; and diminished activity was also reported for nonresidential building. Meanwhile, residential building in February was able to register modest growth. For the first two months of 2011, total construction starts on an unadjusted basis came in at $52.9 billion, down 14% from a year ago. For the 12 months ending February 2012 versus the 12 months ending February 2011, which lessens the volatility present in year-to-date comparisons of just two months, total construction starts were down 2%.

The February statistics lowered the Dodge Index to 80 (2000=100), compared to 85 in January. For 2011 as a whole, the Dodge Index averaged 91. “The pace of construction starts during the first two months of 2012 was subdued, retreating to the lower end of its recent range,” stated Robert A. Murray, vice president of economic affairs for McGraw-Hill Construction. “Renewed expansion for the construction industry is still struggling to take hold, with gains for a few project types such as  ultifamily housing being outweighed by declines for project types that are largely publicly financed. This was especially the case in February, when much of the downward pull came from weakness for public works and institutional building.”

Nonresidential building, at $127.6 billion (annual rate), dropped 7% in February. A large part of the shortfall came from a 22% slide for educational buildings, continuing the descent for this category, which has been underway for the past three years. Public buildings (courthouses, detention facilities, and military buildings) weakened further in February, plummeting 46%. The healthcare facilities category in February decreased 9%, despite groundbreaking for a $335 million medical center replacement project in Joplin, MO and a $180 million hospital tower in Oakland, CA. The other institutional categories reported gains in February, including a 22% increase for amusement-related work, which was helped by a $105 million convention center expansion in San Jose, CA. Transportation terminal work in February advanced 45%, helped by the $78 million addition to Terminal B at George Bush Intercontinental Airport in Houston, TX and a $44 million renovation project at Grand Central Station in New York, NY.

On the commercial side, warehouses and hotels retreated in February, falling 8% and 47% respectively. Office construction improved 11%, reflecting such projects as a $106 million Social Security Administration building in Baltimore MD; a $75 million renovation to the U.S. Department of Commerce building in Washington, DC, and a $65 million corporate headquarters in Malvern, PA. Store construction in February was able to advance 35% from a weak January, aided by the start of a $300 million observation restaurant and entertainment venue in Las Vegas, NV. The manufacturing plant category in February increased 9%, boosted by a $99 million upgrade to a solar panel manufacturing plant in Portland, OR.

Residential building in February grew 3% to $140.6 billion (annual rate). Most of the upward push came from multifamily housing, which rebounded 10% after sliding back in January. Single family housing, up 1%, essentially held steady in February, due to a mixed performance by region?the South Atlantic, up 8%; the Midwest, up 5%; the Northeast, down 1%; the West, down 2%; and the South Central, down 3%.

The 14% decline reported for total construction on an unadjusted basis during the first two months of 2012, compared to 2011, was the result of a mixed performance by major sector. Nonresidential building dropped 17% year-to-date, reflecting this pattern? commercial building, down 9%; institutional building, down 15%; and manufacturing building, down 54%. Residential building climbed 20% year-to-date, with multifamily housing up 23% while single- family housing grew 20% from its very weak amount at the start of last year. Nonbuilding construction fell 33% year-to-date, due to a 20% retreat for public works and a 56% reduction for electric utilities. The size of the year-to-date decline for nonbuilding construction was affected by the comparison to elevated activity during the first two months of 2011, which included such large projects as a $2.5 billion solar power facility in California and $2.1 billion for work on the LBJ Freeway in Dallas, TX. By region, total construction starts in the first two months of 2012 showed an increase for one region, with the South Atlantic climbing 7%, while declines were registered by the other four regions?the Midwest, down 2%; the West, down 11%; the Northeast, down 21%; and the South Central, down 32%.

The 2% drop for total construction on a 12-month moving total basis, meaning the 12 months ending February 2012 versus the twelve months ending February 2011, was the result of this behavior by major sector?nonresidential building, down 3%; residential building, up 8%; and nonbuilding construction, down 10%. By geography, the 12 months ending February 2012 showed the following performance for total construction?the South Atlantic, up 13%; the West, up 3%; the Northeast and Midwest, each down 8%; and the South Central, down 12%.

McGraw-Hill Construction connects people, projects, and products across the construction industry. For more than a century, it has remained North America’s leading provider of project and product information, plans and specifications, and industry news, trends, and forecasts. To learn more, visit www.construction.com.