Category Archives: Global

In the November 2007 issue of Insulation Outlook, “Insulation Systems: Doomed From the Start?” discussed some conditions that can doom mechanical insulation to failure (see www.insulation.org/articles/article.cfm?id=IO071102). The article highlighted the term “value engineering” as it pertains to mechanical insulation, considered how mechanical insulation seems a forgotten technology, and described the effects of compressed schedules that do not give many trades sufficient time to install their systems properly. The article also discussed careless mechanical system installation, including improper installation of insulation materials and carelessness on the part of the insulation contractor. With that as background, this article provides possible solutions to the problems of mechanical insulation failure, starting at the beginning of the construction process. At every subsequent stage of the process, this discussion will shed light on mechanical insulation, “the forgotten technology.”

The importance of the owner and architect recognizing the value of mechanical insulation when developing a project’s construction and completion schedules cannot be overemphasized. The mechanical insulation portion of the construction process is usually at the end of the schedule. The window for the insulation contractor may be smaller as a result of delays at the front end, but no extensions typically are given at the back end. Insufficient time to properly complete the insulation process equals potential for mechanical insulation failure. The owner and architect must recognize the importance of every trade in the construction process. Mechanical insulation is not the only trade that suffers from poor project scheduling. The entire project will suffer if scheduling is not properly considered from the beginning. Many problems can be avoided by considering the trades that get involved at the end of the schedule when planning at the beginning. Specifically, mechanical insulation will be less likely to fail if adequate time is afforded the installing contractor.

With a realistic construction schedule, attention turns to the design team and the mechanical engineer to prepare the drawings and documents for the project. In far too many cases, the mechanical engineer will go to the library, pull an old insulation specification off the shelf, and put it into the bid package. Much of the included specification will not have anything to do with the current project, but it is quicker and easier than developing a specification for the particular job. Specifications for old projects that are used as generic specs for all projects have a tendency to allow the engineer to avoid considering all of the important ramifications of a specific job as it relates to the mechanical insulation. Has the humidity of the space as it relates to the use of the building and the equipment that will be installed been considered? How about new materials available on the market? Do the specifications take into consideration the space available to install mechanical insulation? Have the design criteria—as they relate to mechanical insulation—been adequately considered? If these items are not identified and addressed at the beginning stage of the process, there is a likelihood that failures will occur at the end. The mechanical insulation will become very important when the systems fail and the owner, architect, engineer, general contractor, and mechanical contractors are all trying to figure out why.

Getting It Right the First Time

As an example, consider a building that has been beautifully designed by the architect. The mechanical engineer has identified the proper insulation materials specified for the project based on the use of the building and the conditions under which the mechanical systems will function. The construction process is beginning. The mechanical contractors have been selected and have begun the process of installing pipes for the plumbing and heating systems, as well as the sheet metal for the ventilation. The general contractor has decided that he would rather allow the mechanical contractors to award the mechanical insulation so that he does not have to handle it. The mechanical contractors request insulation prices from various contractors who specialize in installing insulation materials. The insulation contractors are asked to “sharpen their pencils” because everyone has been asked to reduce their prices to get the project under budget. In short, the insulation contractors are asked to value engineer the project to bring it in under budget.

As described in the earlier article in this series, value engineering in far too many cases means either eliminating the insulation or reducing the thicknesses of the materials to reduce the install cost of the project. The owner of the building has no idea that this value engineering is taking place. The owner thinks the final product is going to be the quality building that is being paid for, but when value engineering comes into play, the integrity of the mechanical insulation system is frequently compromised. There are, of course, times when a different material can substitute for the one specified and reduce project costs. All too frequently, however, quality is what gets compromised.

In this case, the owner insists that the mechanical insulation not be compromised: He wants the type and thickness of materials for which he is paying. The bidding process is now complete, and a contractor has been selected. The owner, architect, and mechanical engineer all have been educated to understand that value engineering when it comes to insulation is a bad idea. The project will go forward with the quality specification the engineer selected. Those involved with this project are not forgetting the insulation.

The general contractor (GC) is in a very influential position at this point in the process. If the GC understands the importance of mechanical insulation, he or she can instruct all mechanical trades to install their systems with insulation in mind. The GC can require that the insulation contractor attend the job meetings—which works much better when the GC has made the award and controls the insulation. The GC can insist that the systems be installed with adequate clearance for the insulation and can instruct the other trades to remember that the mechanical insulation must be installed properly—therefore, they are obligated to pay attention to the insulation process.

Now, the piping systems are being installed, and the core openings are not in perfect center. The pipe will fit; it just will not be centered. The insulation contractor will have to make it work. The selected insulation contractor has taken the time to visit the project in the early stages of construction and has noticed this problem. The insulation contractor will discuss this issue with the mechanical and general contractors to ensure that the pipe systems are installed properly to allow for the pipe insulation to be installed. The problem is rectified early in the process. The same thing happens when the pipes are installed too close together to allow for the specified thickness of the insulation materials. It happens again when the sheet metal is installed directly on the chilled water piping system. All parties in the construction process are put on notice by the insulation contractor that the mechanical systems must be installed with adequate clearance to allow for the specified insulation thicknesses to be installed. If this does not happen, the insulation contractor cannot be held responsible for potential failures in the future.

There is no question that in the construction business, nothing is perfect. Mechanical insulation contractors do not expect perfection but can and do expect that their portion of the project be considered by all parties. The National Insulation Association (NIA) and its affiliated regional associations are working to shed light on mechanical insulation (the forgotten technology). Owners, architects, mechanical engineers, and mechanical contractors cannot be expected to be as vigilant about insulation as NIA members are. It can be expected, however, that at this time in history—with the cost of oil and gas going up daily—all parties involved in the construction process become aware of the value of mechanical insulation and address it accordingly. Properly worked-out schedules, with attention paid to details regarding insulation types and thicknesses, as well as the proper clearance for material installation, will help contractors avoid many problems at the end of the project.

Construction Market Forecast: Nonresidential Construction Declines in Some Segments in 2008

FMI, management consultants and investment bankers to the building and construction industry, announces the Construction Outlook: First Quarter 2008 is now available. The Construction Outlook, a quarterly construction market forecast developed by FMI’s Research Services Group, notes that FMI’s outlook for construction for 2008 and 2009 has been revised down since the fourth quarter of 2007.

Recently released economic indicators are far bleaker than the previous months. The housing downturn, weakening employment rates, worsening consumer confidence, credit tightening and the threat of inflation are all factors expected to be drags on the economy, the report indicates.

Nonresidential Construction

Nonresidential construction will see declines in 2008 and 2009, except some publicly funded segments.

The nonresidential segments that are the most cyclical, or tied to the economy, will see declines in 2008 and 2009. These segments include office, commercial, religious and amusement and recreation. Lodging is the only exception as there is enough overhang from starts in 2007 that are still under construction in 2008.

Publicly funded nonresidential segments will fare much better, such as health care, educational, public safety and Homeland Security construction.

Health care construction will remain positive partly due to facility upgrades across the country and seismic retrofits in California. Education construction will decline in some areas of the country due to less property taxes and therefore less state revenue. However, many MSAs and school systems in several states have passed education bonds, which will help to stop growth from turning negative. Higher education will experience steady growth driven by an increase in endowments. Public safety construction will grow because of increasing inmate populations (which is rising faster than the general population growth) and an increase in fire and police stations. Homeland Security port and border work and port work to increase port size to be able to accept post-Panamax sized vessels will help to drive transportation construction. Increased airport delays will also increase construction.

Residential

Housing will affect the economy again in 2008. It is not expected to begin recovering until 2009. All segments of the residential sector will remain down, led by single family (-10%), followed multi family (-7%) and then finishing with improvements (-2%).

Manufacturing

The report also comments on manufacturing. FMI believes it will not experience decreases in 2008 and 2009 partly because it is at a low level; its previous high from 1998 will not be surpassed until 2010. Manufacturing will also benefit from the overhang of some huge projects started in 2007. For the first time, several multi-billion dollar projects are under construction at the same time. Basic materials manufacturing will also help to prop up this segment. Increases in cement clinker capacity, refineries and steel manufacturing will contribute to these gains.

“The economic indicators look bleak for construction in the upcoming year, but the outlook is optimistic for a few nonresidential and nonbuilding segments,” said Heather Jones, construction economist for FMI’s Research Services. “The segments that will remain positive in 2008 are either non-cyclical or are being propped up by large starts last year. The slowing economy will cause total nonresidential construction to decline in 2009 as lower starts in 2008 are finally felt.”

Historical information in Construction Outlook is based on building permits and construction put in place data as provided by the U.S. Commerce Department. Forecasts are based on econometric and demographic relationships developed by FMI, on information from specific projects gathered from trade resources and on FMI’s analysis and interpretation of current and expected social and economic conditions.

Heather Jones, a construction economist for FMI’s Research Services, is responsible for design, management and performance of primary and secondary market research projects and related research activities, including economic analysis and modeling, construction market forecasting and database management. For more information about Construction Outlook: First Quarter 2008 or Heather Jones, contact Tom Smith at FMI Corporation at 919-785-9236 or tsmith@fminet.com.

US Insulation Demand to Reach $11 Billion in 2012

Insulation published in March 2008 by the Freedonia Group researches and forecasts the insulation industry.

Demand for insulation materials in the United States is forecast to advance 5.3 percent per annum through 2012 to $11 billion. Consumption will also benefit from greater insulation use on a per structure basis, as well as insulation upgrades for existing buildings, both residential and nonresidential.

Fiberglass insulation will remain the leading insulation material in use, accounting for more than half of demand in dollar and volume terms in 2012. Growth will be driven primarily by the rebound in new home building, the dominant market for fiberglass insulation. Demand will also benefit from more intensive use of fiberglass insulation per new housing unit, sparked by growing concerns about energy efficiency, and by ease of installation and favorable cost factors.

Foamed plastic insulation is the second largest insulation product in use in the US, accounting for nearly 45 percent of demand in value terms in 2007. Advances will derive from growth in nonresidential building construction activity and increasing penetration of residential markets. Other insulation materials, including reflective insulation and radiant barriers, cellulose, mineral wool, perlite, vermiculite, cotton and other materials, all have niche applications. Reflective insulation and radiant barriers will see the fastest growth (albeit from a small base). These insulating materials will find increasing use in metal buildings and other nonresidential structures, as well as in pipe wrap, appliances and duct insulation, as a means of reducing energy costs.

In 2012, residential construction will account for over 45 percent of demand for insulation in value terms and 60 percent in terms of R-1 insulating value. Gains will be most robust in new construction applications, as the industry recovers from a dreadful 2007 trough. Nonresidential construction markets will also provide growth opportunities, although value gains will be about the same as in the 2002-2007 period, and below the overall average.

The South region is the largest geographic market for insulation, accounting for 38 percent of demand in 2007. The South and the West will post the fastest growth in demand as they continue to benefit from growing populations, better than average economic growth and generally healthier construction activity. The Northeast and Midwest regions, by contrast, will both record below average gains.

Insulation (published 03/2008, 298 pages) is available for $4,600 from The Freedonia Group, Inc., 767 Beta Drive, Cleveland, OH 44143-2326. For further details, please contact Corinne Gangloff by phone 440.684.9600, fax 440.646.0484 or e-mail pr@freedoniagroup.com. Information may also be obtained through www.freedoniagroup.com.

Figure 1

Whose fault is it if a customer does not approve of a company’s energy-savings insulation proposal? Does the customer seem not to understand it? Or is it that he or she cannot get senior management to take a serious look at it?

Could it be the insulation contractor’s fault for not helping the customer fully appreciate the solid economic value of the project he or she needs—and really wants?

Everyone knows there is no such thing as a free estimate. Proposals and estimates require time and money to prepare. The trick is to avoid the mental trap of not investing enough in the next proposal because of subconsciously expecting close ratio of only 20 percent. Understanding the big picture of cost-reduction proposals might provide the motivation to spend a little more time on that next proposal. The truth is, a little more time and a higher level financial analysis could dramatically increase the close ratio, increase sales, make the insulation contractor’s time more productive, and put some energy back into the sales process.

Selling a cost-reduction project like an insulation energy management plan requires new tools for the sales executive. Books and seminars have been written on how to sell to VITOs (very important top officers), as well as selling at the “C” level within the customer organization. Maybe a contractor’s proposals contain the traditional elements and technical data, but those very items could be why the close ratio is low. Technical jargon and reams of specifications and engineering calculations may be of great interest to plant engineers, but they will bore a chief financial officer (CFO). Generally, CFOs are only interested in the investment aspects of a proposal; they assume their company’s plant management previously addressed the technical points.

Simple payback is no longer the primary tool in the financial analysis toolbox. Consider why it is called “simple” payback. A proposed project’s value is likely to be greater than the energy savings alone. It represents permanent improvements in the customer’s cash flow. The time value of money and the increase in positive cash flow are hot items to customers. An insulation contractor’s sales toolbox needs to include the financial impact of secondary benefits, life-cycle costing, return on investment (ROI), net present value (NPV), and asset appreciation. Before using these tools, though, contractors should first make sure that all the benefits the project will produce are accounted for (as line items).

Slight improvements in plant productivity and product quality may be more important than selling just the benefits of the pure energy cost reduction. The conservative value of improved productivity, improved product quality, reduction in product losses or returns, and reduction in production downtime should be considered. Plant management needs to provide—or at least support—the financial value of any added (no energy savings) benefits.

Customers need to perform a cost-benefit analysis of any proposed capital investment. The key word is, of course, “investment,” since a properly engineered insulation proposal is an investment and not an expense. This concept is the same whether the customer places the investment under the operating budget or the capital budget.

Simple Payback

Simple payback is a measure of the time it takes to recover capital spent on an investment. For example, if a $100,000 machine reduces factory production costs by $25,000 a month, the payback period for investing in the machine is four months. As a basic measure of investment attractiveness, the payback period tends to be most compelling when the period is relatively short. A payback rule is a policy to make a capital expenditure only when the payback period is less than or equal to some period, such as one year. Simple payback period does not reflect the value of the cost savings over time. Some people fail to understand that the savings from an insulation project represents permanent savings and an effective lifetime of X years.

Return on Investment

ROI is a variation on simple payback period (one where the investment capital spent is divided by the payback in years) that provides the annual return from the investment. This is similar to the interest rate earned by a savings account. ROI by the payback period ignores the time value of money.

Net Present Value

NPV is a method for evaluating the profitability of an investment or project. The NPV of an investment is the present (discounted) value of cash inflows minus the present value of cash outflows. Here is an example of NPV.

Suppose an investment requires an initial cash outflow of $5,000 and provides cash inflows of $4,000 in year 1 and $3,000 in year 2. Without using NPV, the cash flows simply total $2,000.

Outflow of -$5,000 + 4,000 in year 1 + 3,000 in year 2 = $2,000

With NPV, setting the discount rate to 10 percent, the investment is worth $1,115.70. (Note: NPV can be calculated using the NPV function in Microsoft Excel, explained in more detail later in this section.)

By recognizing the time value of money and equating dollars from different years, NPV makes it possible to evaluate long-term investments. Accurately estimating the cash inflows and outflows for the NPV calculation is tricky; selecting an appropriate discount rate for NPV is also difficult. Nevertheless, NPV is a valuable tool for analyzing capital projects and other investments.

Time Is Money

As the Popeye character Wimpy often said, “I’d gladly pay you Tuesday for a hamburger today.” Much like Wimpy, CFOs would rather pay you in the future than pay you 100 percent today.

Capital budgeting tools like NPV compare the value of investing in an insulation project against the value of investing the funds in some other venture. The other unnamed venture produces an ROI that the insulation project needs to beat (the so-called hurdle rate). The bottom line: If the company believes it can get a 15-percent ROI for its money on another venture, then the insulation project must beat that ROI to be considered. Cash investments generally occur at the beginning (year 0), while project savings occur in a future period. The NPV calculation discounts the future cash flow since the company does not have it today. If the NPV from the insulation project is $1 or more, it beats the hurdle rate and should be considered. While the length of the analysis may vary from company to company, the NPV basics do not change. Therefore, it is helpful to learn the NPV “discount rate” before preparing the financial analysis of a proposal.

NPV can be run using Excel, which also can be used to represent the expected cash flow in charts that make cash flow from various sources (utility savings and other economic benefits) easy to visualize.

Asset Appreciation

Many commercial owners are interested in any project that improves profitability. Reduced operating expenses equal better operating profit. The most interesting aspect of this improvement in the bottom line is that this cash flow is worth several times its actual amount to the business. An extra $100,000 in cash flow could be worth 10 times that amount—or $1 million—to the value of the asset. This is a hot button with a number of owners.

Tools Are Available

The U.S. Environmental Protection Agency (EPA)/Department of Energy (DOE) EnergyStar program offers nearly 300 software tools, including Excel files, to analyze the financial value of proposed energy-related improvements. Free EPA/DOE tools include
the following:

Using tools like these and writing in the language of CFOs, insulation contractors can give customers the information they need to better understand the financial aspects of their insulation proposals. Instead of having to process unfamiliar terms like British thermal units (Btus) saved per year, CFOs can relate to the project as to any other capital investment. The insulation project now can be connected to the cost per ton of product the company manufactures. Suddenly, the project can relate to a public company’s dividends.

See the Difference

As a CFO, which version of the insulation proposal on this page and page 44 would draw the most attention—and serious consideration for funding?

In a real insulation project, the numbers obviously will be much higher—and, therefore, more important—to the CFO or other top officer looking at the value of an insulation project over time. The U.S. EPA/DOE EnergyStar program’s free Financial Value Calculator (www.energystar.gov/ia/business/financial_value_calculator.xls) converts the savings and improved cash flow into the impact on the company dividend.

The Bottom Line

With a little extra effort, a CFO-class insulation “investment proposal” should get the customer’s attention and move quickly into the corporate finance department for a capital investment review. If the numbers are good, conservative, and supported by middle management, an insulation contractor’s chances of success are quite good.

Figure 1
Figure 2
Figure 3
Figure 4
Figure 5
Figure 6
Figure 7
Figure 8

The “NIA World” encompasses the commercial and industrial insulation market segment, which includes all facets of mechanical insulation; a significant portion of commercial building insulation; metal building insulation; and a part of the heating, ventilating, and air conditioning (HVAC) market. It is generally accepted that the NIA World does not include the majority of insulation-related activities in the HVAC, residential, original equipment manufacturer, automotive, appliance, aerospace, and other specialty markets. This article explores some of the significant opportunities and challenges the NIA World faced in recent years, as well as the opportunities, challenges, and potential fundamental changes the industry may expect for the current year and beyond.

Recap of the Recent Past—How Did We Get Here?
In 2005, the industry was rebounding from the two catastrophic fiberglass manufacturing facility fires that occurred in 2003, facing concerns over whether there was sufficient manufacturing capacity to sustain long-term demand. The instantaneous loss of industry capacity disrupted supply not only for the fiberglass segment, but for manufacturers of alternative materials as they stepped forward to fill the supply void. The entire industry felt the financial and operational impact of those fires, and lessons were learned: The availability of insulation materials never may be taken for granted, and many changed the way they view supply-chain alliances.

In 2006, there was an increased focus on rising energy costs and the burdens and opportunities they created, with a spotlight on the environment and the sustainability movement. Simultaneously, frustration grew over insulation being the “Rodney Dangerfield” of energy conservation and emission reduction initiatives, garnering little respect.

In 2007, the industry dealt with issues that included acceptance of foreign-manufactured materials, product innovations, the erosion of the mechanical insulation knowledge base, a changing investment portfolio, the shortage of qualified and experienced field labor, and the need for industry benchmarking.

Over the past three years, the NIA World has demonstrated its resolve in recovering from the industry-changing events of 2003 while confronting the challenges of daily business, embracing available opportunities, and creating others. The NIA World has grown stronger than it has been in many years.

2008: A Time To Panic or Hold the Course?

The last three years had a common denominator: an expanding market in a confusing but stable or growing economy. Although 2005 through 2007 were not without their challenges, it was hard to find an industry participant who was not enjoying a good year. People were generally optimistic about the coming years. This article will look at some of the factors expected to affect the industry—positively and, potentially, negatively—in 2008.

This year began with an uncertain economy in an election year. How will that affect the industry? Some profess doom and gloom, while others confront the challenges directly. All will want to take full advantage of the opportunities and generate an acceptable return—the definition of which varies greatly—to their shareholders. One source for this article suggested the subtitle, “My crystal ball is foggy.” To some, a potentially slower growth rate, or a flattening or slight decline in the market, may be a reason for panic. Others see it as an opportunity to strengthen their company for the next surge. There are a host of differing opinions on expected industry growth rates—or lack thereof—for 2008 and 2009. The degree of variance depends on market segment, geography, product line, and whom you ask or what market projections you endorse.

The industry has never been particularly good at projecting growth rates. Regardless of historical perspective, the process for predicting the future is the same: Absorb and dissect all the information available; look at the customer base, backlog, and pending projects; and make an educated guess. Best estimates are submitted to management, where they are assessed as either “sandbagging” or overly optimistic (rare) before being adjusted and released. No one, whether manufacturers, contractors, and distributors—is immune to this process.

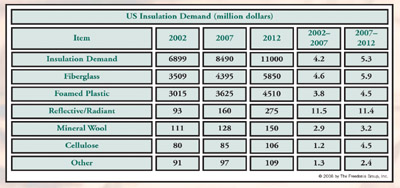
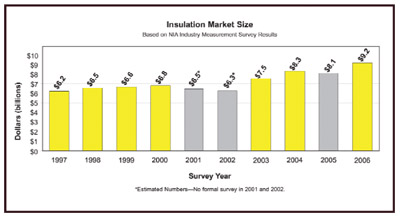
One might ask if mechanical insulation market discussions have become part of the feeding frenzy driven by the decline in the U.S. housing industry, the high cost of energy, and the weakened dollar. These discussions must sound familiar to industry old-timers. For instance, consider the National Insulation Association’s (NIA’s) industry survey for 1997 to 2006. There were some tough times in those years, but the industry continued to expand and improve over time.

The following are a few reasons the overall mechanical insulation market may be stronger than some predict.

  • The industrial market is forecast to remain strong through 2008 and the first half of 2009 (potentially through 2009 into 2010).
  • The maintenance segment is slowly regaining momentum. Facilities cannot delay needed maintenance forever without creating much bigger problems.
  • The commercial sector traditionally lags 6 to 12 months behind the residential sector. Many projects are in varying phases of design and construction. A slower commercial market may not develop until the second half of 2008.
  • Health-care facilities and school construction in some geographical areas may not suffer from the effects of a slower economy.
  • Although single-family housing starts are down, multifamily housing is up in many areas.
  • Opportunities will be generated by higher energy costs bringing renewed focus on the environment and the continuing demand for more power.
  • The demand for alternative fuel sources is expected to continue.
  • The sustainable building movement is growing, not declining.
  • Export opportunities are strong for U.S. products and systems.
  • People and companies are beginning to think about insulation differently.

Will growth come from increased units or dollars? Most would agree that in 2008, dollar growth probably will exceed unit growth.

The NIA World is not immune to the effects of the overall economy, and it has its own set of challenges, but it remains a great industry. Two years from now, what will the NIA industry survey reveal about 2007, 2008, and 2009? If historical patterns are relevant, then the industry should trend upward.

Fewer “Feet on the Street” Telling the Insulation Story

While there are always exceptions, overall it appears that manufacturers have fewer “feet on the street.” What’s more, those may not be “happy feet,” given expanded territories, increased responsibilities, and the pressures those developments create. It also appears that they are younger, which is great from one perspective but may be less desirable from an insulation market and product experience perspective.

What is driving this trend? The first thought is cost reduction, but there may be other fundamental changes.

  • Ninety-five percent or more—some estimate 98 percent—of all materials flow through the distribution channel. As this percentage has steadily increased and distributors have become more sophisticated in sales, manufacturers have shifted more of the sales responsibility to the distributor.
  • Market share among manufacturers of similar products has not changed greatly over the years, especially at the contractor level. If Contactor 1 likes product X, the company more than likely will continue to favor that product. Combine that with distributor relationship preferences, and not much change in market share is driven by increased manufacturer presence on the street.
  • The industry has not seen significant shifting of market share among the various product groups (filtering out the impact of major projects).
  • Manufacturer product quality and customer service continue to improve, which equates to fewer field problems.
  • Experienced “peddlers” are retiring and not being replaced. Their responsibilities are being distributed among others.
  • The Internet and other technologies play more of a daily role in the dissemination of information.
  • Designers, specifiers, and end-use customers seem to have less time to discuss new products and systems; at a minimum, it is harder to get to see the right person.

The younger generation is bringing fantastic new life into the industry. They are talented and proficient at multitasking. The concern, though, is that they are often spread too thin. As such, their contribution is not what it could be. Overall, product and application experience comes from on-the-job training. The industry has been less than tolerant of that approach, especially when the personnel turnover rate seems to be increasing. Could fewer experienced feet on the street compound the problem created by the eroding knowledge of mechanical insulation at the engineering, architectural, and facility-owner levels? It is something to think about.

Industry Consolidation: Will it Continue and How Will it Affect the Industry?

All indications are that consolidation will continue in all segments, but not at the pace experienced from 1995 to 2005.

Consolidation has changed the industry’s profile and will continue to shape the industry. Insulation industry participants primarily drove consolidation until a few years ago. Now, industry consolidators are competing with investment banking firms that find the industry attractive. Characterizing the mechanical insulation industry as consisting of a group of small to midsize family owned and operated business, sometimes second and third generation, may not be accurate anymore. One thing has not changed, however: The industry is very much relationship based. Consolidation will have a hard time changing that.

One of the most recent notable changes is in the contracting segment. Fueled by the injection of capital from investing firms, “roll-ups” are emerging. Contracting services that encompass mechanical insulation are an example. Larger firms are developing that offer an array of services including scaffolding, painting, insulation, abatement, cleaning, demolition, and mechanical maintenance. Although this strategy appears to have the greatest impact in the maintenance sector, it also will affect new construction. The diversity of services can offer advantages to the end customer. However, some caution customers not to jump to that conclusion too fast.

Can this strategy yield the expected returns to the company’s shareholders and to the ultimate customer? The future will answer that. There is no question it will change certain aspects of the industry. Consider this: Does your company specialize in mechanical insulation and refractory applications, or does it offer those services among many others? If you are a facility owner, would the answer influence your purchasing decision?

Influx and Acceptance of Foreign-Manufactured Materials: What Changed?

The acceptance of foreign-manufactured materials in all product groups has grown since the 2003 fiberglass manufacturing facility fires. Specific information was not available to confirm whether or not the level of imports changed. The general feeling is that direct imports into the United States decreased; however, the wild card is determining the level of product coming in from the U.S. northern border.

One core question still concerns quality verification. This is not to suggest that imported materials are inferior to those manufactured in the United States. This discussion is not focused on manufacturers that are major contributors to the U.S. market and have plants elsewhere; it is focused on materials imported through a variety of other channels.

Companies considering the acceptance and use of foreign-manufactured materials should ask some core questions before making their final decision, beginning with whether the materials are tested and performance measured on the same basis as U.S. manufactured materials. The burden of proof and ownership of the material ultimately lies with the end user, but all participants in the decision-making process will shoulder some degree of responsibility if a failure occurs. A failure of any magnitude, regardless of cause, is detrimental to the industry. Assumption of material equivalence and warranty support could be costly.

Many codes, regulations, and/or specifications require that materials be evaluated in accordance with a variety of tests. However, most do not specify third-party testing or verification. Industry consumers see the tests listed on the data sheet and take for granted that the material was tested correctly and the results are current and based on the material they are receiving. Maybe it is time for the industry to consider the value of specifying recognized third-party testing. The industry has historically self-policed, and that process has worked well. However, times have changed. No one wants to openly challenge another’s test results. When suspicions occur, the resulting discussions are unofficial, take place in quiet corners, and basically are an avenue to vent frustrations without taking any official action. That is probably not the best solution for the industry.

Technology: Is the Industry Embracing Change?

There is no question that the Internet has become the primary communication and information source within the industry. Contractors are receiving more inquiries and drawings via the Internet and on discs. There is some movement toward the Building Information Modeling (BIM) approach. However, other uses for technology (such as online ordering) have not gained the momentum once predicted. Standardized industry bar coding has so far failed to materialize, and vendor-managed inventory systems have not been generally embraced. There are also other examples of how technology has not had the impact and influence in the mechanical insulation industry that it has in other industries.

It appears that companies are implementing varying forms of technology primarily for internal efficiencies and/or cost-reduction purposes. There seems to be reluctance to push for an industry-wide approach to embracing technology for other purposes than improved communications. There are varying opinions as to why that is; however, given the fast pace of technology, that will change over time.

Does a lack of industry-standardized bar coding, nomenclature, units of measure, packaging, and similar items create a barrier? Or is technology simply not being driven from the top down or bottom up, and between market channels? This is a subject worth exploring. Who will take the lead?

The Value of Insulation: Why Not Just Do It?

Industry participants understand the value of insulation, the return on investment (ROI) opportunities, and all of the other advantages that properly designing, installing, and maintaining an insulation system can provide. Why is it so hard to relay that message and convince others to take action?

The problem can likely be summarized into the following broad topics:

  • Reduced knowledge base
  • Competing initiatives
  • Lack of oversight by some governing organization
  • Limited available capital
  • The need for continually and consistently marketing the value of insulation

Reduced knowledge base. The engineering, architectural, and facility-owner knowledge base of mechanical insulation systems has been eroding for years. This is being driven by multiple developments, including rightsizing, multitasking, attrition, and retirement. In addition, insulation system technology is not being taught; it is merely touched upon in engineering universities, colleges, etc.

As discussed previously, the manufacturing segment of the industry has less experienced feet on the street. Historically, they were the primary industry educators. The Internet is being used extensively for information gathering, but is that sufficient to replace the eroding knowledge base? There is no single recognized and accepted industry standard, guideline, specification, approach, etc. The reduced knowledge base also has yielded fewer “insulation champions” within companies to fight for insulation initiatives, which further compounds the problem.

Competing initiatives. Especially in the field of energy conservation, insulation systems are competing with dozens, if not hundreds, of other initiatives, such as lighting, solar panels, motors, steam management, controls, and equipment efficiency. The insulation industry must compete for maintenance and capital dollars.

As has been said many times, “Insulation is not a sexy subject.” Many would prefer to discuss shiny moving parts, lights, and fancy equipment. The industry needs to understand it has competition and fight for its fair share, combating lack of knowledge and helping people understand the ROI to sell insulation over competing initiatives.

Lack of oversight by some governing organization. Energy codes have not had the impact some had predicted. Some would argue that they are not being enforced. Regardless, energy or other codes do not address many mechanical insulation applications in the commercial building segment and address few, if any, in the industrial segment.

Lack of codes or regulations—or not understanding and enforcing what is there—does not help foster insulation discussions. Codes or regulations should not be the primary driver for increased use of mechanical insulation, but they certainly help draw attention to the opportunity that insulation can provide, increasing the knowledge base and, accordingly, the use of mechanical insulation. Industry participants need to pool their resources and address this matter on a non-biased basis.

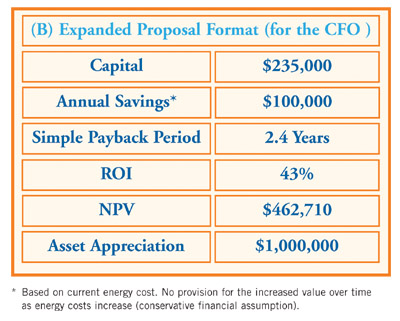
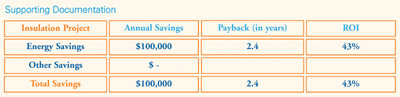
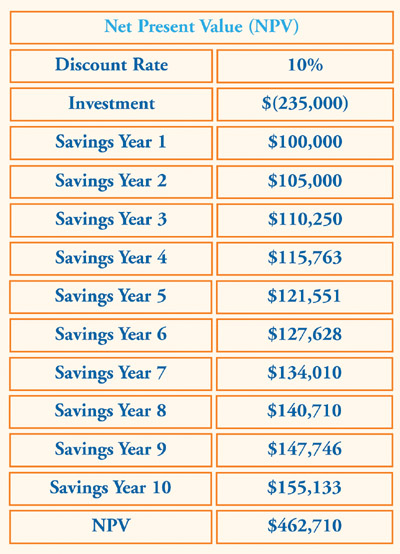
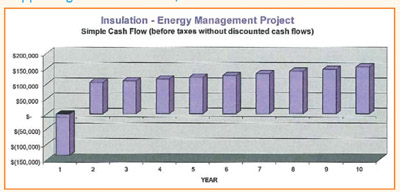
Limited available capital. Insulation competes with other initiatives and must fight for capital, whether for maintenance, renovation, or new construction. The selling approach should be modified to include not only the normal expected benefits and simple ROI calculation, but also all of the other financial attributes, such as present value of money, asset appreciation, and cash flow. Mechanical insulation can provide an unrivaled investment opportunity. All industry participants need to demonstrate that story time and time again. They can do that by choosing not to participate in what some refer to as a flat market and by making their own opportunities.

Marketing the value of insulation. Relatively few marketing dollars are expended by industry in explaining the value of insulation. The majority of the marketing dollars, especially on a national scale, is expended by the manufacturers. Some may be sharing a bigger burden than others. Regardless, those marketing dollars focus on creating product specifications or preference, rather than on spreading the message about the value of insulation at large.

Those in the insulation industry should consider whether they subscribe to the philosophy that making the pie bigger and better will ultimately make their slice bigger and better. Or do they want to focus on making their slice bigger and better, regardless of whether the pie grows? What scenario would yield the industry the biggest bang for the buck?

Is it easier to grow the industry with a collaborative approach or an individual company–focused approach? There are many components to this question, but it seems that pooling resources—within all legal and protocol parameters—to promote the value of insulation in an unbiased fashion would allow the industry to compete better with other initiatives, tell the insulation story more effectively, and help stop the erosion of the mechanical insulation knowledge base. Perhaps more companies would look at insulation differently and “just do it.” The industry pie becomes bigger, and everyone’s piece should grow and be more profitable. Maybe the industry should examine a generic, industry-wide marketing program to simply sell the value of mechanical insulation.

It’s All About People

The need to recruit people into the industry, at all levels, has never been more important. Several of the bigger companies have recruitment programs primarily geared toward sales, estimating, and management. Has the industry reached the point where NIA, in conjunction with its members, should have a recruitment program geared not only toward these areas but also toward recruiting tradespeople to consider the insulation industry as a career choice? The NIA World can be a good career choice.

Looking Forward

The NIA World remains strong. Opportunities greatly outnumber challenges, and many challenges are really disguised opportunities. The U.S. economy will affect the insulation industry. But when, to what extent, and for how long?

The industry is expected to post moderate, low-single-digit growth in 2008. Predictions for 2009 do not project any major directional change. Without a doubt, it will be more difficult to manage business and deliver the expected returns, but when has that not been a problem in a troubled economy? The mechanical insulation industry has been there before and demonstrated its resolve to succeed time and time again. Industry members should expect nothing less in 2008, 2009, or 2010.

Several years ago, the industry embarked on multiple outreach initiatives to stimulate growth through education and awareness programs. At the time, industry members had no way of realizing the importance of those initiatives today. Supporting and expanding the scope of those initiatives is more important than ever. That could be one of the greatest industry challenges over the next five years. During struggling economic times, many companies tighten their belts as the first and potentially only line of defense versus strengthening their sales and marketing efforts. With a reduced knowledge base of specifiers and purchasers, the opportunities being driven by higher energy costs, and the increased focus on the environment, traditional approaches may not be the best solution. Now may be the time to invest. Industry members could make their own opportunities, rather than blaming the economy.

Many end-use customers are searching for ways to lower their cost of manufacturing or operations, increase cash flow, and comply with regulatory requirements. This sounds like a good audience and a perfect time to tell the insulation story. The industry must compete for maintenance and capital dollars, and create opportunities.

The Bottom Line

Even with all of the potential challenges, this is an exciting time for the NIA World. It continues to be a promising industry with opportunities that make it a great career choice for the next generation and an investment opportunity for all those who act on it.

SIDE BAR

Other Opportunities and Challenges

Looking to the future, other areas that warrant monitoring for their affect on the NIA World in both the short and long term include the following:

  • Vertical integration in the manufacturing sector
  • Contractors and distributors increasing their examination of “Greenfield” expansion opportunities, which may create complexities for manufacturers and ongoing industry consolidation
  • Product price increases driving the investigation of alternative products
  • Sustainable design (“thinking green”) continuing to gain momentum
  • The nuclear power industry expanding, with new plants on existing sites
  • Product innovation and application techniques to lower the installed cost, and their influence on the market
  • The importance of safety continuing to be emphasized throughout the industry
  • Crossover strategies being initiated as concerns for the economy continue
  • The suggestion that the “Value of Distribution” be revisited—especially the role of the manufacturer and distributor in the channel (what are their mutual expectations and roles in the market?)
  • Asset management—capital utilization continuing to be a major focus in all segments
  • Electronic forms of training continuing to increase as employers seek to provide affordable education and training
  • Expense control possibly taking center stage for many companies in 2008 and potentially 2009
  • Succession planning continuing to be of major importance
  • Events overseas possibly affecting the U.S. market (especially the mechanical insulation sector) in today’s global economy
  • Project scheduling continuing to be compressed, and the percentage of incomplete drawings not being expected to change; some estimate that projects are being bid with only 60 to 70 percent of the drawings complete (and possibly less)
  • “Big Box” distributors continuing to struggle to successfully participate in certain industry segments, but probably not aborting their exploratory efforts
Figure 1

In the Save Energy Now (SEN) initiative of the U.S. Department of Energy’s (DOE’s) Industrial Technologies Program (ITP), Energy Savings Assessments (ESAs) of steam as well as other industrial plant systems are performed to identify energy conservation opportunities. Steam System Assessments consider the design and operation of the plant in the context of the BestPractices steam criteria. The adequacy of thermal insulation for piping, tanks, and other elements of the distribution systems are among the characteristics evaluated. The analysis approach involves observing the condition of the distribution system and using the 3E Plus® insulation tool and the Steam System Assessment Tool. Readers who are unfamiliar with these tools are encouraged to visit the BestPractices Steam website at www1.eere.energy.gov/industry/bestpractices/steam.html.

The condition of the thermal insulation observed during the Steam System Assessment varies. In some cases, limited repair of damaged insulation and the addition of insulation previously missing on steam supply lines are the only requirements. This may affect as little as 10 percent of the length of steam mains and laterals. In other cases, however, the length of steam piping affected is more significant due to systems having undergone substantial alterations without replacement of insulation. The insulation of valves, pipe sections with gauges and sensors, and “T” sections and elbows is another frequently observed opportunity.

The conditions associated with condensate return systems vary even more widely. In some circumstances, the energy conservation opportunity is limited to selected repair of condensate mains and laterals. However, in other cases, the condensate piping is found to be completely non-insulated, as it was believed to be unnecessary because of the following:

  • The lower temperature of the pipe
  • The fact that the losses are often to conditioned spaces

Despite these perceptions, eliminating the uncontrolled loss of energy to various spaces usually represents an energy conservation opportunity. This article provides reflections—from an owner’s perspective—from six recent steam system efficiency improvement projects.

A Good Place To Start

In a food processing plant using high-pressure steam for sterilizing and cleaning operations, the steam system is the backbone of the operation. The system in this plant is old, and had not been well maintained over a period of several years, as evidenced by leaks and deteriorated or missing insulation in many areas.

The new plant engineering manager had received a mandate to reduce utility costs. His initial response was to insulate distribution piping—steam and condensate that carried steam from the boiler plant to the end-use loads through the maintenance shop. Based on the system assessment, several measures were recommended, including eliminating leaks, improving boiler efficiency, and performing additional insulation repairs.

The plant engineering manager needed a “quick fix” that was visible as a statement to both corporate management and the maintenance staff that things were improving. The assessment validated the cost-effectiveness of the investment in pipe insulation, showing a payback of 1 year or less on additional insulation that would save $45,000 per year. Since completing the assessment, additional insulation repairs have been performed, along with leak repairs and other operational improvements.

Distribution System Effects

Distribution system energy losses can vary from 10 percent to more than 25 percent of a central boiler plant’s output. A major factor influencing these losses is the length of steam and condensate piping that the plant serves, along with the condition of the insulation. Based on the existing conditions found at one facility—with a system consisting of more than 1 mile of steam piping—reducing the losses from uninsulated segments lowers thermal losses from 15 percent of average boiler output to 4 percent. The insulation work involved less than 20 percent of the mains and laterals. The work on the condensate return system involved about 1/2 mile of pipe. Losses represented about 15 percent of average boiler output, while the fully insulated condensate piping is reduced to 4 percent of boiler load.

At a plant with an installed boiler steam output capacity in excess of 175,000 parts by weight per hundred parts by weight (PPH), and an extensive distribution system made up of both underground and overhead piping, the recommendation to improve plant insulation was the first to be implemented. The owner’s representative recently reported that the insulation work was reducing energy, but the extensiveness of the need at this facility required that the work be phased with the distinct subsystems’ insulation to be repaired in a sequential manner. The owner’s representative realized that some level of attention would be needed on a continuing basis—a key observation for sustaining the benefits the plant was beginning to realize.

Steam Generation Capacity And Actual Conditions

As a corollary to the preceding observations, steam systems serving manufacturing operations with a large space footprint will expend a significant part of the plant output keeping the steam lines hot and supplying auxiliary steam for plant operations. For example, a plant that was recently assessed had two central plants—each with less than 20 million British thermal units per hour (mmBtu/hr) of output capacity—was estimated to use almost one-third of the exported steam keeping the distribution system hot. At this plant, the steam condensate is returned at a low temperature—less than 150°F. This results in the need for a significant auxiliary steam load to raise the condensate temperature to boiler entrance conditions. Not correcting this deficiency would pose a threat to boiler life due to thermal shock.

Repairing the insulation on the steam lines, adding insulation to previously uninsulated condensate return piping, and taking steam and condensate piping out of service to abandoned operations were among the most cost-effective opportunities identified at this site.

At the same location, the condensate-receiving tank was not insulated. This was found to add losses of 400,000 Btu/hr, adding 20 percent to the losses from the piping system. With this justification, the owner’s representative contracted to have the tank insulated.

As with the prior case, the owner’s representative indicated that the recommendations relating to the thermal insulation deficiencies were among the first to be implemented. He expected that the work would continue as an ongoing process.

Relative Value

At another manufacturing plant, improving the insulation on a steam and condensate piping system that consists of about 1 mile of mains and laterals was estimated to save more than 6 mmBtu/hr—about the same savings that would result from the addition of a feedwater economizer in the central plant. However, the payback of a year or less for the insulation measure is much more favorable than the 4- to 6-year payback associated with the economizer.

As a result, the insulation work was initiated, and the economizer is still considered an interesting idea.

More Than Economic Merit

A recent assessment of a beverage bottling facility provides another example of the importance of insulation repair projects to system efficiency programs. The review of the overall system identified numerous opportunities, including burner change-outs, boiler operating changes, process control improvements, and insulation. The deficiencies were identified early in the assessment during field surveys of existing conditions. The insulation opportunity was discussed with the owner’s representative, who responded by hiring insulation contractors to replace the missing insulation.

The work was done quickly, the results were visible, and the payback was fast—less than1 year. As with the food processing plant, the plant started realizing energy cost reductions immediately, and the newly reinsulated pipe caused a boost in maintenance staff morale.

Underground Piping

Many steam systems, especially district systems, transport steam through buried pipes and underground vaults with branch connections and blocking valves. Buried piping can benefit from the insulation qualities of typical soils, unless there are leaks or high groundwater levels. The challenge with underground systems is typically maintaining insulation quality in manholes and underground vaults. These areas are where maintenance activities are most likely to occur and are subject to the usual wear-and-tear and attention-to-detail issues that all too often allow long-term degradation of pipe and valve insulation to occur. While the piping in manholes may only represent 2 to 5 percent of the overall system length, as the examples above have shown, small sections of uninsulated piping and valves have a significant impact on distribution system energy losses.

This was illustrated during another recent activity involving a large steam distribution system with more than 10 miles of steam and condensate mains and laterals. At this site, analysis has shown that improving manhole conditions, including steam and condensate pipe insulation repairs, is estimated to save about $500,000 a year, with a payback of about 1 year.

Final Tips

What does it take to minimize steam system losses due to substandard insulation over an extended period? The following comments from owners’ representatives provide good guidance:

  • Get started somewhere—but get the work started.
  • Stay at it. As several of the examples cited above indicate, it is a long-term process.
  • Savings will be apparent quickly, and returns on the investment are rapid. Additional benefits include cleaner plant spaces and improved morale for facilities engineering and maintenance employees.

To reduce administrative time hiring insulation contractors for what can be many short-term tasks, some representatives also indicated that they established long-term contracts that set out agreement conditions and costs, authorizing specific tasks under “task orders.” Task-order contracts can expedite the front-end time to get a specific insulation task completed.

The U.S. Department of Energy (DOE) Save Energy Now (SEN) program has sponsored numerous steam Energy System Assessments (ESAs) that have identified a range of energy conservation measures to reduce the cost of generating steam in industrial facilities. The assessments use the BestPractices Steam tools as the basis for the analytical methodology. The energy conservation measures that are typically considered are listed in Table 1.

The 21 measures represent a range of opportunities that include operational changes, low-cost projects, and higher cost projects. Experiences with Measure 16, “Improve Insulation,” are the subject of this narrative, as observed by SEN program practitioners during the course of 11 ESAs.

Critical Questions

The assessments use the following BestPractices Steam tools:

  • The Steam System Scoping Tool (SSST), which is an operational practices self-evaluation checklist
  • The Steam System Assessment Tool, which contains calculation algorithms to evaluate the energy cost reduction opportunity for the 21 measures
  • The 3E Plus® insulation assessment tool

The SSST serves as an excellent diagnostic tool to guide the in-plant analyses conducted during a 3-day, on-site activity. During this part of the assessment, the following questions posed to the operators often provide the most useful input for the analyses:

  1. How many steam traps are in the distribution piping, and are they routinely maintained?
  2. What is the condition of insulation on the piping, tanks, and valves?
  3. What is the approximate length of steam mains and laterals in the system?

Questions 2 and 3 set the stage for the insulation analysis to be performed. Most operations personnel are realistic in their responses to Question 2, though there are differing perceptions about the importance of condensate pipe insulation. Based on responses to Question 3, the length of the principal pipe segments in the system is often not readily known.

System Characteristics

The systems assessed by the authors of this article thus far:

  • were installed for eight different industrial process sectors;
  • had installed capacities ranging from more than 1 million pounds per hour (PPH) to less than 50,000 PPH;
  • had pressures of 1,000 pounds per square inch gauge (PSIG), with superheat to 5 PSIG; and
  • had distribution pipe networks of lengths that range from more than 2 miles to approximately 3,000 feet.

The condition of insulation on the steam distribution piping varied widely, but in all cases some level of improvement opportunity was identified. Conditions ranged from deterioration over a period of years and lack of reinsulation when piping changes had been made to missing insulation on steam laterals and complete subsystems, as well as uninsulated condensate return piping. Valves, sensors, elbows, and other system appurtenances are frequently totally or partially uninsulated.

Estimating Losses

A two-step methodology is employed to estimate losses. An important part of the on-site investigation is “walking the system” to observe the distribution piping, including lengths and locations, pipe sizes, and insulation types and condition. The information collected during the field survey is entered into a site-specific spreadsheet that results in a baseline estimate of piping system losses. Table 2 is a partial example of the spreadsheet. It lists the approximate lengths and condition of the various segments of pipe observed during the field survey. Total length of uninsulated pipe is listed, and a weighted average pipe diameter is determined. These are inputs needed to run the 3E Plus model.

For this case, the system was transporting steam at 5 PSIG, which has a saturation temperature (the temperature at which condensation occurs at this pressure) of 228°F.

As noted above, valve bodies are often left uninsulated or have their insulation blankets removed and not replaced. To include some allowance for insulated valves in the insulation measure evaluations, tables were developed that interpret losses in “equivalent feet” of pipe. The tables are based on information contained in U.S. DOE Steam Tip 17, which lists savings potentials for installing removable covers on valves. The losses in British thermal units per hour (Btu/hr) relate to about 3.5 linear feet of bare pipe for fluids of 400°F. The basis for this estimate is indicated in Table 3.

With the benefit of the survey and analysis, the 3E Plus tool can be used to determine the heat lost from the bare pipe segments and the savings due to insulation. Assuming 2 inches of calcium silicate with an aluminum jacket, the average size 6-inch-diameter pipe will change from losing 360 Btu per square foot (Btu/sq ft) of pipe surface to losing just 21 Btu/sq ft.

The annual cost savings resulting from insulation repairs for this project now can be estimated, as indicated in Table 4.

The results shown in Table 4 are not for an actual site but are representative of a heating plant with a relatively extensive piping network. The savings shown are for steam piping only.

Similar analyses for a condensate system showed comparable savings. The temperature of the condensate pipe is lower than the steam pipe (150°F to 180°F compared to 228°F for steam in this case), and condensate piping is smaller in diameter than the steam pipe-typically half the size. However, the quantities in linear feet of uninsulated condensate pipe tend to be larger, sometimes representing more than 50 percent of a condensate network.

For the SEN ESAs, the results of this methodology, along with the other measures, are then used in the Steam System Assessment Tool analyses to determine the aggregate energy cost reduction opportunity.

While cost estimates for the energy conservation opportunities are not generated as part of the assessments, rough budgetary estimates are reported to the DOE based on experience with other projects. Short-term paybacks, in the range of 2 years to less than a year, are frequently observed.

What Does This Mean To Managers and Owner?

It is interesting to consider the characteristics of this hypothetical system from the perspective of lessons for management. As Table 4 shows, annual losses for the reinsulated steam system are 1,190 million Btus (mmBtus) on an annual basis. While only about 15 percent of the existing piping required reinsulation, thermal losses will be reduced by 60 percent.

To put these values in an operational perspective, the energy required to keep the steam lines in steady-state operation can represent a significant portion of plant capacity or a single boiler’s output. The analysis shows that, with a properly insulated system, losses can be cut in half or reduced even more than that.

In some cases, where large distribution systems serve small boiler plants, uninsulated pipe also can cause operating problems, such as low condensate return temperatures, or poor-quality steam before reaching the end of mains or laterals. These issues increase boiler maintenance costs and can cause premature equipment failures.

Based on the SEN assessments, there are substantial cost-effective opportunities to reduce steam system inefficiencies by applying insulation to bare or damaged pipe segments, tanks, and valves. In some circumstances, a secondary benefit due to reductions in other maintenance costs will also occur.

Figure 1
Figure 2
Figure 3
Figure 4

The American Institute of Architects (AIA) has introduced Integrated Project Delivery: A Guide (The Guide). Developed jointly with the AIA California Council, The Guide was created to help define the world of integrated project delivery (IPD) as the design and construction industry continues to move toward more effective and collaborative team approaches.

Technological evolution coupled with owners’ ongoing demand for more effective processes that result in better, faster, less costly, and less adversarial construction projects are driving significant and rapid change in the construction industry. Envision a new world where:

  • facilities managers, end users, contractors, and suppliers are all involved at the start of the design process;
  • processes are outcome driven, and decisions are not made solely on a first-cost basis;
  • all communications throughout the process are clear, concise, open, transparent, and trusting;
  • designers fully understand the ramifications of their decisions at the time the decisions are made;
  • risk and reward are value based and appropriately balanced among all team members over the life of a project; and
  • the industry delivers a higher quality and sustainable built environment.

This is the world of IPD, which leverages contributions of knowledge and expertise through early collaboration and utilization of new technologies. This allows all team members to better realize their highest potential while expanding the value they provide throughout the project life cycle.

At the core of an integrated project are collaborative, integrated, and productive teams composed of key project participants. Building upon early contributions of individual expertise, these teams are guided by the following principles:

  • Trust
  • Transparent processes
  • Effective collaboration
  • Open information sharing
  • Team success tied to project success
  • Shared risk and reward
  • Value-based decision making
  • Utilization of full technological capabilities and support

The outcome is the opportunity to design, build, and operate as efficiently as possible (see Figure 1).

The Guide provides information and guidance on principles and techniques of IPD and explains how to use IPD methodologies in designing and constructing projects. A collaborative effort between The AIA National and AIA California Council, The Guide responds to forces and trends at work in the design and construction industry. It may set all who believe there is a better way to deliver projects on a path to transform the status quo of fragmented processes yielding outcomes below expectations to a collaborative, value-based process delivering high-outcome results to the entire building team.

Benefits to architects, engineers, contractors, and other end users will include but not be limited to the following:

  • Better communication on the critical issues facing practice today
  • A better process for working with clients, consultants, and builders
  • Value-based compensation models
  • Appropriate sharing of risk and reward
  • A more relevant profession that exceeds expectations, freeing architects to truly be designers again

Significant cultural change will be required to achieve these outcomes. Insurance, legal, and educational models, as well as basic practice tools and issues, will have to change. The AIA is working closely with owners and contractors to overcome these challenges.

For more information and to download a copy of The Guide or to learn more, please visit www.aia.org/ipdg.

Figure 1

History

Polyolefin closed cell tubular insulation was developed in Europe in the 1970s. Much of the development work was done in Belgium. It was first introduced in the United States in 1979 as a do-it-yourself insulation in semi-slit, three-foot lengths. During this time, the country was undergoing our first energy crisis, with government rebates for home insulation improvement, so polyolefin insulation quickly caught on as a pipe insulation for domestic hot and cold water.

During the early 1980s, a preslit/preglued product was introduced and polyolefin insulation was brought to the commercial market for hot and cold water, drain pipes, and other applications. The market migrated to the preslit and preglued, 6-foot product as the main product offered in ⅜ -, ½-, ¾- and 1-inch wall up to 4-inch iron pipe size (IPS) IDs. Further advances of the product into lower-temperature applications, including cryogenic industrial applications, came in the late 1990s. Although it has found successful applications in the industrial market, the primary market for polyolefin insulation continues to be plumbing—hot and cold water, and roof drains.

The Manufacturing Process

Polyolefin closed cell tubular insulation is predominately comprised of polyethylene resin, which is one of many resins in the polyolefin family. For this reason, the product is also often referred to as polyethylene insulation. Other resins in the family would be polypropylene and ethylene vinyl acetate. Polyethylene resin has a very sharp melting point, and this characteristic is key to the manufacturing of the product.

To begin the manufacturing process, polyethylene resin pellets are fed into an extruder along with other ingredients such as UV and heat stabilizers, colorants etc, which are also in pellet form. All of these materials are melted and blended together.

In the second phase of the extrusion process, a physical blowing agent (typically a hydrocarbon), which is in the form of a gas, is injected into the extruder under high pressure and blended into the molten mixture. The material is under pressure in the extruder as it is pushed through a die at the end of the extruder, forming the tubular shape. The die consists of an outer ring with a pin in the center that forms the ID of the tube. As the material exits the die, it immediately expands as the blowing agent normalizes the pressure. Because the mixture exits the forming die at a temperature very close to the melting point of the resin, it quickly sets up or solidifies and maintains its cellular structure rather than collapsing its shape. The material is then cooled down completely, cut to length and packaged.

The product can be slit and pressure-sensitive adhesive can be applied to the seam, if requested, during the cooling process. The process runs quickly, and there is little waste. Any scrap generated during the manufacturing process can be recycled back into the process since the material remains a thermoplastic and it can be remelted.

Product Characteristics

The majority of polyolefin insulation sold is in tubular form. The current preformed size limitation is 4-inch IPS x 1-inch wall. The product can be sleeved to achieve greater wall thicknesses. Manufacturing methods are currently under development to expand both the ID and wall size range.

The product gets its physical property characteristics from its base resin (polyethylene) and the fact it has a closed-cell structure. Polyethylene resins offer great water, chemical, and abuse resistance as evidenced by its other applications, such as beverage containers, trash bags, life jackets, and other consumer items. The closed-cell structure of polyolefin insulation also provides its thermal properties (k value).

Polyolefin insulations are identified by American Society for Testing and Materials (ASTM) C 1427. They are suited for applications within a temperature range of -150°F to 200°F, which fits well with their primary application of hot and cold water lines, as well as roof drains. Polyolefin insulations have low water-vapor permeability characteristics, as evidenced by a water vapor transmission (WVT) permeability rating of .05 perm-inch max. Caution does need to be taken not to use these materials on above ambient temperatures applications above 200°F.

Polyolefin insulations are easy to work with. No special tools or protective clothing are required. The most predominantly used form is preslit/preglued, which almost eliminates the need for additional adhesives on most jobs. It can be easily fabricated in the field with a sharp knife.

Common applications include the following:

  • Hot and cold water (domestic and commercial)
  • Roof drains
  • Cold process pipes and equipment
  • Heating, ventilating, and air-conditioning (HVAC) equipment

Specific physical properties of the material can be found on the National Insulation Training Program (NITP) chart at www.insulation.org/techs/MaterialsSpecs.pdf under Polyolefin Sheet and Tube.

Additional information can be found in the Manufacturers’ Technical Literature (MTL) Product Catalog at www.insulation.org/mtl or on specific manufacturers’ websites.

Readers who are interested in learning more about the insulation material featured here should visit the MTL Product Catalog at www.insulation.org/MTL or visit the NIA Membership Directory at www.insulation.org/membership to find a manufacturer.

NIA Members who would like to author a future column should contact publications@insulation.org

Figure 1

Vestal Tutterow is a Senior Program Manager at the Alliance to Save Energy with over twenty-five years of experience in buildings and industrial energy systems analysis and program management. Vestal’s experiences also include energy assessments and modeling and public/private industrial partnership development. He has a BS in Mechanical Engineering and Materials Science from Duke University and a MS in Systems Management from the University of Southern California. He is also a registered Professional Engineer and a Certified Energy Manager. Vestal can be reached at (202) 530-2241 and vtutterow@ase.org.

Q: Congress recently passed energy legislation to reduce the nation’s dependence on foreign oil and improve U.S. energy security. However, the Energy Independence and Security Act, signed into law on December 19, 2007 and effective January 1, 2009, essentially ignored the industrial sector and the energy savings opportunities at industrial facilities. Is the federal government doing anything to encourage energy improvements at industrial facilities?

A: While the Congressional legislative package overlooked the industrial sector, the Department of Energy’s Industrial Technologies Program (DOE-ITP) has for many years promoted industrial energy efficiency. DOE-ITP research and development activities explore long-term process efficiency improvements; and its BestPractices activity provides a large portfolio of technical advice, software tools, and educational workshops to help industries identify efficiency improvements that can be made today. The DOE-ITP Save Energy Now campaign offers Energy Savings Assessments (ESAs) to qualified large industrial energy users. This campaign is now in its third year, and the assessments are revealing an average energy savings potential of $2.5 million. Additional information, including case studies and eligibility, is available at www.eere.energy.gov/industry/saveenergynow/. Small and medium-sized facilities can receive 1-day energy assessments provided by one of the 26 university-based Industrial Assessment Centers located throughout the United States.

Q: Do any of these activities relate to the mechanical insulation industry?

A: Several of the most recent ESAs include mechanical insulation as one of the efficiency improvement projects. Typically, these opportunities were identified through use of the 3E-Plus software tool. The DOE is developing case studies for a portion of the facilities that implement projects identified through the ESAs. Insulation Outlook has featured some of these case studies and will explore the results of current insulation projects in future issues once the case studies are finalized.

Q: Are there any federal agencies other than the DOE offering programs to help the industrial sector become more energy efficient?

A: Yes. The Environmental Protection Agency (EPA) has developed ENERGY STAR for Industry to provide guidance, including an energy management assessment matrix that helps facilities think strategically about energy management. Additionally, facilities in certain subsectors (automobile assembly plants, petroleum refineries, cement plants, and wet corn mills) can achieve an ENERGY STAR for Plants designation if they are among the top 25 percent most energy-efficient plants for that subsector.

In addition, the Manufacturing Extension Partnership (MEP) within the National Institute of Standards and Technology (NIST) offers lean manufacturing, energy, and environmental services to manufacturing businesses through its university- and state-based centers located throughout the United States. See www.mep.nist.gov/centers-near-you/index.htm for locations of the MEP centers.

The DOE recently teamed up with the EPA and NIST to create the Energy Quick Start web site, which provides a convenient source for easy access to the large array of free and low-cost resources, tools, and training available from the federal government and other organizations. The new site is at www.energyquickstart.org.

Q: How can I find out about government-sponsored activities in my region or state?

A: The DOE has a new web page that provides data on industrial energy use by subsector for each state. The information is searchable by state and includes a listing of ESAs performed in each state, along with points of contact for the DOE, Industrial Assessment Centers, and MEPs. The web page also includes a link to energy-improvement incentives and rebate programs within each state.

Readers are encouraged to submit their own insulation questions to industry experts by e-mailing asktheexpert@insulation.org. Questions can be on any insulation topic. Future topics will include CUI, mold, boilers, insulation maintenance, acoustics, and energy issues.

There are a number of effective ways to prevent corrosion under insulation (CUI) on pipes and equipment that operate at above ambient temperatures. Some people think that the best approach is to coat the pipes prior to installing the thermal insulation and not worry about what type of insulation to use. Others believe the best approach is to find the perfect type of insulation—the “silver bullet”—that will never allow CUI. Still others think that if facility owners would simply spend the appropriate money, time, and effort to maintain their insulation systems so as to keep out water, CUI would not be a problem. This article explores these different approaches in more detail.

Operating Temperature As a Variable

It is impractical to discuss the prevention of CUI without first considering the effect of pipe operating temperature. For corrosion of steel to occur, four factors need to be present: (1) water; (2) oxygen; (3) corrosive chemical(s); and (4) a suitable temperature. Since only a small percentage of pipes actually operate in this range, CUI is only likely to occur when a pipe operating at an above-ambient service temperature is shut down for service. That happens to all pipes sooner or later. As water vapor does not lead to corrosion, liquid water must be present for CUI to occur. That will be the case at 100° to 300°F (50° to 150°C), according to an article by Dr. Hira S. Ahluwalia (see “CUI: An In-Depth Analysis” in the November 2006 Insulation Outlook). Corrosion will not occur on a 600°F pipe, at least not while it is operating at that temperature. It will occur when the pipe is shut down, is in the process of being shut down, or is being brought back to temperature. If a pipe operates continuously at a temperature where water is likely to be present much of the time (such as on a 150°F pipe), the probability of CUI occurring is much greater.

For a carbon steel pipe with a process temperature between 100°F and 300°F then, water that leaks into the insulation system will sooner or later find its way to the interface between the pipe and the insulation. Invariably, there will be some chlorides or other corrosion-causing chemicals in the environment that will dissolve in the water that gets to the pipe. Consequently, for a low operating temperature, with an insulation system that leaks and an uncoated pipe, the conditions for CUI are close to ideal.

Available Tools To Prevent CUI

In terms of preventing CUI, it is worth examining what tools are available to prevent it. There are a number of different tools that can be used, some more effective than others and all with limitations.

These can be classified in the categories of protective jacketing materials, insulation system maintenance, protective coatings, and insulation materials.

Protective jacketing. The first rule to understanding prevention is to keep water out of the insulation. Regardless of the type of thermal insulation, keeping water out starts with the protective jacketing. The quality of the design, specification, procurement, installation, and maintenance of the protective jacketing system is always critical to preventing CUI. Standard 0.016-inch-thick aluminum jacketing, as well as steel sheet jacketing, installed with caulks and mastics, can effectively keep water out of the insulation system. To be effective, it is critical for everyone involved (the general contractor, insulation contractor, design engineer, and facility owner) to make certain that no shortcuts are taken in design, material specification, and installation. Both conventional aluminum jacketing and steel jacketing can be effective at keeping out the intrusion of water and preventing CUI. Hence, protective jacketing is the most important tool in the CUI prevention toolbox.

A new type of protective jacketing material that is seeing increasing interest is multilaminate, pressure-sensitive jacketing that can be purchased for either field installation or can be purchased factory applied to certain types of insulation. This family of materials essentially consists of industrial-grade tapes, available in 3 foot widths, that are weather resistant; impermeable to water or water vapor; resistant to many chemicals; and able to seal tightly with their pressure-sensitive, “peel-and-stick” surfaces. Some of these are available in industrial-grade weights with a thickness of almost 0.016 inches. An important accessory to making the system effective in keeping out water is a 2- to 4-inch-wide roll of tape to seal the joints and the penetrations. This type of material offers a jacketing that can be adhered to the insulation, thereby preventing moisture from accumulating between the jacket and the insulation. Its flexibility allows for easier installation and sealing at joints and penetrations as well as at termination points, making it very effective at keeping out water. Therefore, wide multi-laminate tapes should be included in the CUI prevention toolbox.

A third type of jacketing, that is durable and effective at keeping insulation beneath it dry, is a glass fiber lagging cloth with an acrylic weather coating mastic. This type of jacketing has the advantage of being able to seal penetrations effectively, to prevent water leakage. Another advantage is that is can be extremely durable, as well as being water proof. Therefore, lagging cloth with an acrylic weather coating mastic should be included as a tool in the CUI prevention toolbox.

Insulation system maintenance. If the pipe insulation is covered with well-designed, well-installed, and well-sealed jacketing, as discussed in the above section, then it is well protected against CUI. However, once this has been accomplished, the system must be maintained. Therefore, the next tool in the CUI prevention toolbox is insulation system maintenance.

For example, consider an insulated pipe that:

  • is several decades old;
  • has an original insulation system of the same age;
  • is located in a relatively rainy climate (something other than the U.S. desert southwest and, at the extreme, along the coast of the Gulf of Mexico);
  • has been shut down for an extended period of time during the system’s life;
  • is uncoated; and
  • has been poorly maintained.

In this case, it is highly likely that the pipe has suffered from CUI. It would be completely unrealistic for the owner or anyone else to expect to not find CUI. In such a case, the CUI is not necessarily the fault of the insulation system design. It further is probably not the fault of the protective jacketing or the insulation material(s). The problem is that when a system has not been well maintained, water—perhaps with dissolved salts from the Gulf of Mexico spray—eventually will get beneath the jacketing between the pipe and the insulation materials, and it will lead to corrosion of the pipe.

In his article, “Is There a Cure for Corrosion Under Insulation?” (Insulation Outlook, November 2005), Mike Lettich emphasizes the necessity for effective maintenance in the battle to prevent CUI. For example, if the insulated pipes have been walked on, resulting in denting of the metal jacketing, there will be water intrusion. If the caulk along the overlapped butt joints has not been periodically replaced, it will become brittle and lose its sealing capability, and rainwater eventually will leak into the system. If caulk around the penetrations—particularly along the top sides of the pipes—has not been examined and replaced as necessary, water will intrude.

For better or worse, the world experienced a prolonged period of very low energy prices from about 1985 to about 2002, with a few, occasional short-term spikes in natural gas prices. With low energy prices, many process pipelines simply were not well maintained due to inadequate maintenance budgets. (This was not the case with all facilities, but it occurred all too often.) With a poorly installed jacketing system—and one inadequately maintained—the insulation system will simply leak rainwater, and CUI will eventually occur. All types of insulation material can be used effectively, up to their design temperatures, if water is kept out of the system. If water gets into the insulation and CUI results, to then simply put all the blame on the materials that make up the insulation system is to put the blame where it should not be placed.

Protective coatings. These coatings can protect carbon steel pipe from water, air, and corrosive chemicals. With those three elements, as well as time and a certain temperature range, corrosion will occur. The first line of defense is the protective jacketing. The second line of defense is insulation system maintenance. Protective coatings on the pipe provide a third line of defense in the prevention of CUI.

Immersion-grade coatings, which are organic, are becoming widely used to coat and protect pipes that operate at or below 300°F. The reason for this temperature limitation is that above that temperature, most organic coatings thermally decompose. Therefore, immersion-grade coatings are an effective tool up to a 300°F operating temperature. They can be considered a valuable tool on carbon steel pipes. The drawback to facility owners, of course, is that they are a financial investment—one that not every facility has been willing to make when operating on inadequate budgets.

In the article, “Corrosion Under Insulation: Prevention Measures” (Insulation Outlook, October 2007), Dr. Hira S. Ahluwalia describes thermal spray aluminum (TSA) coating in great detail. He points out that TSA coating is effective up to a maximum temperature of 1,000°F, much greater than the 300°F limitation of organic, immersion-grade coatings. This type of coating is reportedly more expensive than the immersion-grade coatings, and some facility owners may not think that CUI prevention is worth the investment. However, the expense needs to be evaluated financially through a life-cycle cost analysis, considering not just the initial cost of the TSA coating, but also the value of the pipe, its life expectancy, and the financial risks associated with repairing corroded pipes, fittings, and other components. If the facility is to be brought out of service for any extended period of time, offering an opportunity for water to intrude and CUI to occur, then TSA coatings should be considered. Therefore, TSA coatings are a valuable tool to prevent CUI for piping systems that operate at temperatures between 300°F and 1,000°F.

Insulation materials. Many different types of insulation materials are used on above-ambient pipes and equipment in industrial facilities. It is important to understand that if the facility owner keeps water from intruding into the insulation system in the first place, the facility is not likely to suffer from CUI. If water does occasionally intrude, coatings on the carbon steel pipes and equipment are a backup defense in the CUI prevention battle, as they protect the pipe itself. If this has been done, then any type of thermal insulation, well maintained and operating within its normal temperature limits, can be used without CUI occurring. Nevertheless, under certain circumstances, water, with dissolved corrosive chemicals, sometimes does intrude. It sits on an uncoated carbon steel pipe for extended periods of time. In those cases, certain types of insulation have features that make them tools in the CUI prevention toolbox.

The first of these is hydrophobic (or waterproof) insulation. Several types of commercially available insulation materials have a chemical hydrophobe added in sufficient quantity to make them truly water repellent. These include perlite block and pipe, aerogel blankets, and certain designated hydrophobic microporous insulations (those specifically coated with a hydrophobe). Mineral fiber insulation materials use the same type of hydrophobe, but in lesser percentages than the other materials, and they can still absorb water. Hence, while mineral fiber insulation is somewhat water repellent, it is a wicking material and cannot really be considered water repellent in the way that the other three materials can.

The hydrophobe typically used for some of these hydrophobic insulations is an organic silicone emulsion. It can be added during material manufacturing process. In the case of aerogel insulation, the material is made hydrophobic by virtue of the manufacturing process, by which organic methyl groups are added to the inorganic silica aerogel material. In all cases, this hydrophobic treatment will remain functional apparently up to a temperature range of 400° to 600°F. In that temperature range, the organics, that make the insulation hydrophobic, start to decompose and the insulation becomes less hydrophobic. Therefore, service temperature is the major limitation of the hydrophobe within hydrophobic insulation, regardless of insulation type.

There is an ASTM test for insulation hydrophobicity after heat aging. ASTM C610, the standard for expanded perlite block and pipe material, includes a water-absorption test for material first heat aged in a 600°F oven. The maximum allowable water absorption, after subsequent immersion in water for 48 hours, is 50 percent by weight. Nevertheless, when this material does absorb water and remains wet for a prolonged period of time, the chemical bonding agent is susceptible to failure, possibly leading to physical degradation of the material. However, a major benefit of this behavior is that the bonding agent is an excellent chemical inhibitor against CUI. Expanded perlite has this advantage and hence can be considered a tool in the CUI prevention toolbox for two reasons: One is its hydrophobicity and the other is that it contains a chemical inhibitor against corrosion.

As discussed above, aerogel blanket insulation and hydrophobic microporous insulations are hydrophobic in the service temperature range where the organic material, that make the insulation hydro-phobic, does not thermally decompose. Once the organics decompose, if these insulations are later exposed to water, they will then absorb the water. Later, if dried out, thermal conductivity will have permanently increased due to damage to the tiny pores that make these types of insulation so thermally effective when new. At that point, the insulation will no longer be as effective a thermal insulation as when new. Nevertheless, these two types of insulation can be valuable tools in the CUI prevention toolbox for service temperatures from ambient to the range of 400° to 600°F. For use above that temperature range where CUI prevention is a goal, the insulation manufacturers of these materials should be consulted to ensure that conditions are avoided where excessive loss of hydrophobic treatment and subsequent absorption of water might occur.

How about the effectiveness of closed cell inorganic insulation? There is only one: cellular glass insulation. Indeed, it holds very little water due to its closed cell structure and the fact that water does not pass between the cell walls. While not exactly hydrophobic, it will not absorb water. This behavior can be an important potential contributor to preventing CUI.

In “Corrosion Under Insulation: Prevention Measures” (Insulation Outlook, October 2007), Dr. Hira S. Ahluwalia recommends the use of cellular glass. However, since cellular glass is fragile, it is susceptible to vibration-induced damage and can suffer from boiling water trapped between the pipe and the insulation. Therefore, its effectiveness can be limited. Further, as with many types of insulation, the boiling of water is damaging to the cellular glass structure. One point worth noting, since stress relief cracking of cellular glass typically begins to occur at service temperatures above 450° to 500°F, the manufacturer should be consulted for the best method for insulating these systems. While cellular glass insulation has some limitations in above-ambient applications, it can be considered an effective tool against CUI for applications up to 450° to 500°F.

What about corrosion inhibitors? It was already mentioned that expanded perlite contains an excellent corrosion inhibitor. Some types of calcium silicate also contains a considerable quantity of chemical inhibitor—not as a bonding agent but as an additive specifically intended to be a chemical inhibitor and thereby to prevent CUI. If calcium silicate insulation with a chemical inhibitor absorbs water, the chemical inhibitor dissolves and inhibits against corrosion.

In general, high-compressive-strength insulation provides better resistance to external loads than low-compressive-strength insulation does. These materials provide better support for the metal jacketing, limiting its compression, denting, and opening of gaps.

Expanded perlite and calcium silicate insulations both have high compressive strengths. The compressive strength for expanded perlite, per ASTM C610, is a minimum of 60 pounds per square inch (psi). For calcium silicate, the compressive strength is a minimum of 100 psi, per ASTM C533. That is the highest value of any commercially available block and pipe insulation.

On an insulated pipe or surface that is subjected to external loads, such as foot traffic, the high compressive strengths of perlite and calcium silicate will provide extra support to the metal jacketing system, helping prevent the jacketing from “fish-mouthing” at the overlaps. Fish-mouthing of the metal jacketing will allow for rainwater intrusion. By virtue of providing better support of the metal jacketing, calcium silicate and perlite insulations are considered valuable tools for CUI prevention, with calcium silicate being the strongest material available. As mentioned above, both of these materials contain a corrosion chemical inhibitor. Furthermore, expanded perlite has been included above due to its hydrophobicity.

Summary

There really is no single “silver bullet” that will prevent CUI in all circumstances and all applications. However, there are a number of different tools that can be used, each of which brings numerous features and benefits. By combining several of these tools, the facility owner can reduce the instances of CUI to the point of prevention. This may require spending more money up front on the new facility, specifying and selecting the protective jacketing system and insulation materials more carefully and thoroughly, and spending time and money maintaining the insulation system. If it is done, however, it will reduce the overall operating cost for the facility. As always, “an ounce of prevention is worth a pound of cure.”

Figure 1