Category Archives: Global

Leaders the world over face the same tough safety challenges that stand in the way of 0 injuries. These challenges begin with attitude and awareness; change, communication, and compliance; and risk and training. If everyone is going to go home alive and well at the end of every day, these challenges need to be met head on, managed, and solved—at least to the extent they can ever be solved.
In reality, challenges like these never really get solved; there will always be new changes to be executed and new people to be trained, making managing safety performance a never-ending battle. In a day of the life of a leader, not having to face any one of those challenges seems like a good thing—it means one less problem to have to worry about, or spend time managing to keep everybody safe.

Still, there is always one tough safety challenge every leader in the world should be thankful to have, the one that comes as good news and is evidence that the leader is doing a good job managing safety. That challenge? Complacency, of course. It’s the challenge every leader wants to face, but never wants to be a victim of.

The Challenge of Complacency

There’s a long list of people, places, times, and situations where complacency would never be a problem. A new person completing a new task may be nervous, inexperienced, self-conscious, over-prepared, or overwhelmed, but never complacent.

In the middle of a crisis—emergency, fire, rescue, abnormal situation—those involved are stressed, stretched, and in a situation where consequences and risk are greatly elevated.

But, they’re not complacent.

The day after a big, negative event—like the crises that didn’t turn out well—everyone is worried, fearful, or depressed, but not complacent.

So, when are people complacent? When they’re doing something routine and easy, something they’ve done so many times they don’t even have to think about what they’re doing. Complacency can also occur when there’s been a long run of success, such as a million hours without anyone getting hurt. Success breeds complacency, proving no good deed ever goes unpunished.

The challenge of complacency is the reward a leader gets for doing a great job managing all those other tough safety challenges. The one exception might be awareness—complacency reflects a lack of acute awareness of the hazards potentially present in a situation. It’s not a case of “people aren’t thinking” but rather a case of “people aren’t thinking about what they’re doing right now.”

Complacency is a lagging indicator: it’s a challenge that shows up late in the process of managing safety performance. If you solve training, normalize operations, get things running like clockwork, and get great safety performance, complacency should be the predicable outcome.

If every leader were looking, even waiting, for this problem to show up, complacency wouldn’t be the big problem it all too often is. The problem is that leaders themselves often fall victim to complacency without even realizing that they have.

Leader complacency doesn’t look anything at all like what it’s supposed to look like. You picture the complacent leader, sitting in the office, sipping the morning’s latte, reading the performance reports, (they’re wonderful), and waiting for the phone to ring.

That’s the theory. In practice, the leader who’s gotten complacent on safety is running late to the safety award celebration; on the phone with the customer, talking about more business; or in a planning meeting for the expansion project. They’re working on a special assignment for “the next big thing.”

In business, there’s always some next big thing to get excited about. Thinking, “Now that we’ve won that safety award or got safety fixed, we can turn our attention to…” is the surest sign that the challenge of leadership complacency on safety has arrived. That’s when the clock starts ticking: it’s only a matter of time before safety performance starts getting worse.

In real life, safety never really gets fixed, it just gets managed. The better it gets managed, the easier it is for leaders to take their eyes off that prize and devote time and attention to other things. It’s perfectly understandable: what supervisors and managers do for a living is solve problems. With complacency, there is no problem—yet.

Lurking

Whether it’s a crew, department, site, division, or an entire company, managing safety performance boils down to leaders getting their followers to raise their game and work more safely than they would have if left on their own. Raising the game of all those followers puts culture squarely in the crosshairs of every leader.

Culture operates like a giant flywheel in organizations, providing stability and inertia. It takes a great deal of energy to change the course of direction, for better or worse. That’s why every leader who tries to change the culture always has to overcome resistance (“I don’t want to do it that way”) and habit (“That’s not the way we’ve always done it.”)

If the culture change effort is actually successful, the function of the flywheel becomes positive. The safety culture becomes an attractor rather than a detractor; things that don’t match the culture—unsafe behavior and equipment, to name 2—are quickly singled out and corrected: “That’s not the way we do things around here.”

That’s the point at which the flywheel provides the energy to maintain the culture. Businesses that achieve this are said to have an “interdependent safety culture.” This reflects the idea that performance is great because everyone is taking active ownership of safety.

While we may know how this culture looks, the question remains as to how we can achieve that culture and how it can be maintained. The answers are obvious, and they suggest the problem that cultural flywheel can mask: the leader’s complacency.

The flywheel of safety culture can keep things going in a good direction for a long time—even when management has moved on to the next big thing. However, simple inertia will not keep safety culture intact forever. Slowly, even imperceptibly, that positive energy will begin to dissipate.

In a perfect world, when complacency begins to show up in management, followers would lead their leaders: “Boss, you used to put a whole lot more pressure on us to work safely. You used to be a lot tougher on us. You used to ask a lot more tough questions. You used to check up on us. You used to hold us accountable. If you don’t go back to doing that, one of us is going to go home hurt. None of us want to be that guy.”

If this occurred, those followers would be doing their leader a big favor—not to mention a big favor to themselves: going home alive and well at the end of the day is the whole point of managing safety. However, that’s not what tends to happen in the real world. Without the continuous investment of a leader’s energy in managing safety, performance will plateau.

It is important to note that workers must also stay vigilant in regard to safety. It is easy to become complacent and pay less attention to safeguards—both employees and management should work together to ensure safety remains a priority.

Warning: Complacency Ahead!

Once you start looking for it, complacency is pretty easy to spot. The problem is, complacent people don’t normally go looking for a problem. When everything is going well, they see no need to look for issues.

When things are going great, who thinks they need to pay attention to some problem that probably doesn’t even exist in the first place? It would take more than a bit of paranoia for a leader to be thinking, “It’s too quiet. Nobody’s worried. That worries me.”

When you pause and reflect—something very few busy leaders have time to do—on the potential problem of complacency, it’s not that hard to recognize its warning signs. There are behaviors—words and actions—that are clear indications of the onset of complacency. It’s even possible to create a measurement of its leading indicators.

Warning Words

Observe the behaviors and monitor the conversations that suggest people are getting complacent. For example, complacency is beginning to set in when people say things about safety processes and performance such as:

•     Do we really need to keep doing this?
•     That’ll never happen here.
•     We don’t have to worry about that.
•     That really is a waste of time.
•     I can’t remember the last time I saw a problem like that here.
•     We don’t have that problem.
•     We’re doing great.
•     Now that we’ve got safety under control.

These words indicate a complacent attitude—if they are coming out of the mouths of employees, or even worse, a leader, then it is time to reevaluate safety culture and practices.

Warning Signs

Then, there are actions; if complacency is beginning to creep into your workplace, you may observe the following:

•     Small problems go unreported.
•     More deficiencies show up in audits and inspections.
•     Less time is taken when doing pre-job checks.
•     Fewer people participate in safety meeting discussions.
•     It’s easier to find equipment and condition problems out on the job.
•     Leaders spend less time working on safety.
•     Fewer questions are asked by the boss about safety.
•     Safety performance flatlines—even when the line goes through zero.

Safety is never a “process under control,” because people are never under control. Safety performance can get better and it can get worse. The zeros that show up as measures at the bottom line—lost workdays, medical treatment cases, property damage—are dependent variables in the process. It takes a lot of effort over a long time for those numbers to get to zero.

Those dependent safety performance variables reflect the contribution made by key independent variables such as compliance, training, equipment condition and operation, and leadership. Those variables can begin to show signs of deterioration long before the dependent variables they control indicate any signs of a problem. Using a series of those metrics would be the simple means of constructing an early warning indicator of complacency.

The bottom line on the challenge of complacency: it’s always the last thing to show up in the process of managing safety performance. Knowing that, as safety performance gets better and better, complacency is the big thing every leader needs to be looking for and actively protecting against.


Copyright Statement

This article was published in the July 2017 issue of Insulation Outlook magazine. Copyright © 2017 National Insulation Association. All rights reserved. The contents of this website and Insulation Outlook magazine may not be reproduced in any means, in whole or in part, without the prior written permission of the publisher and NIA. Any unauthorized duplication is strictly prohibited and would violate NIA’s copyright and may violate other copyright agreements that NIA has with authors and partners. Contact publisher@insulation.org to reprint or reproduce this content.

More than a year ago, the Occupational Safety and Health Administration (OSHA) promulgated a new standard for addressing respirable crystalline silica. The Standard was effective on June 23, 2016, but enforcement was only to begin in the construction industry on June 23, 2017, and in the general industry on June 23, 2018. Recently, OSHA delayed the enforcement period for the construction industry respirable silica standard by 90 days, to September 23, 2017.

It is important to note that the protocol set out in the construction industry for respirable crystalline silica, which is in 29 CFR 1926.1153, and the general industry respirable crystalline silica standard, which is found at 1910.1053, are significantly different. Because the construction industry respirable crystalline silica standard will become enforceable in September, this commentary will be limited to that particular standard.

OSHA defines respirable crystalline silica as quartz, cristobalite, or tridymite contained in airborne particles that are determined to be respirable by a sampling device that meets the characteristics for respirable particle sizes. The action level has been set at 25 micrograms per cubic meter and the permissible exposure limit is 50 micrograms per cubic meter. The permissible exposure limit has been reduced to about 20% of the old permissible exposure limit set forth in the previous silica standard. The construction industry silica standard provides 2 methods by which an employer can be in compliance with the exposure limits on respirable crystalline silica.

In this Standard, OSHA has again created a need for the employer to designate a trained competent person. Under Section 1926.1153 (g)(4), the employer is required to designate a competent person to make frequent and regular inspections of the job sites, materials, and equipment to implement the written exposure control plan. This competent person is defined as an individual who is capable of identifying existing and foreseeable respirable crystalline silica hazards in the workplace and has the authorization to take prompt corrective action to eliminate or minimize them. More so, the competent person is required to have the knowledge and ability necessary to fulfill the responsibilities connected with making frequent and regular inspections of the job site.

The Standard also calls for an initial site assessment regarding possible exposure to respirable crystalline silica, much as the construction industry’s confined space standard requires the competent person to survey the job site before work begins to identify all permit and non-permit confined spaces.

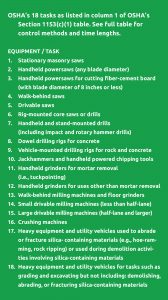
In Section 1153(c)(1), OSHA has mandated that for each employee who is engaged in any of the 18 specific tasks that are identified in Table 1 of the Standard, the employer shall fully and properly implement the engineering controls, work practices, and respiratory protection specified for the tasks listed—unless the employer assesses and limits the exposure of employees to respirable crystalline silica in accordance with Subpart (d) of the Standard.  OSHA is requiring that an employer who is engaged in any one of the 18 enumerated tasks comply with the engineering work practice control methods and respiratory protection requirements set out in Table 1 for that identified task—unless the employer implements the alternative exposure control methods listed in Subpart (d) of the Standard.

Each of the 18 tasks enumerated in Table 1 of the Standard provides for specific engineering and work practice control methods that the employer can use to reduce employee exposure to respirable crystalline silica. In addition, the standard specifies the type of personal respiratory protective equipment that should be worn by employees even when the employer is employing the work practice control methods set out in Table 1.

Many of the tasks identified do not require any personal respiratory protective equipment if the employer is complying with the engineering work practice control specified, but employers should check the Table to determine whether their actions have freed them from a personal respiratory protective equipment requirement.

If not using Table 1, the employer is directed to review the requirements in 1926.1153(d), which provides for alternative exposure control methods. This section applies either if the employee is performing tasks not covered by Table 1, or if the employer has not fully or properly implemented the engineering controls, work practice controls, and respiratory protection specified in Table 1. Section 1926.1153(d)(1) provides for a permissible exposure limit of 50 micrograms per cubic meter calculated as an 8-hour Time-Weighted Average (TWA). The general requirement in this section states that the employer is required to assess the exposure of each employee who is or may reasonably be expected to be exposed to respirable crystalline silica at or above the action level if tested in either the performance option or the schedule monitoring options set out in Paragraph (d)(2) of the Standard.

The performance option requires the employer “to assess the 8-hour TWA exposure for each employee on the basis of any combination of air monitoring data or objective data sufficient to accurately characterize employee exposure.” Objective data is defined as air monitoring from industry-wide surveys, or calculations based on the composition of a substance, that demonstrate employee exposure to respirable crystalline silica associated with a particular product or material, or a specific process, task, or activity. The data must reflect workplace conditions closely resembling those, or have a higher exposure potential than the processes, types of material, control methods, work practices, and/or environmental conditions present in the employer’s current operations. For those familiar with OSHA’s Air Monitoring Requirements for Hazardous Materials, this is similar to a negative exposure assessment. What OSHA is telling us in this section is that the employer can either obtain the air-monitoring data of each employee performing a task in which they may be exposed to respirable crystalline silica, or the employer may rely upon objective data obtained from industry sources—or a combination of both. You must use care to ensure the objective data upon which you are relying meets the Standard’s definition of objective data and is representative of the work you are doing with the materials in question.

The scheduled monitoring option provides that the employer shall perform initial monitoring to assess the 8-hour TWA exposure for each employee on the basis of one or more personal breathing zone samples that reflect the exposures of employees on each shift, for each job classification, and in each work area. The Standard does provide that where several employees perform the same tasks on the same shift and in the same work area, the employer may sample a representative fraction of these employees rather than having to sample each employee.

The important thing to note here is the employer’s responsibility to perform an exposure assessment for each employee who is, or may reasonably be expected to be, exposed to respirable crystalline silica. This means that it is the employer’s responsibility to assess the work site daily—especially if other contractors will be working in the same area—and determine whether, as a result of its own work or the work of some subcontractor or the owner, its employees may reasonably be expected to be exposed to respirable crystalline silica above the action level. In making this initial assessment, you must bear in mind that the action level for exposure is only 25 micrograms per cubic meter over an 8-hour TWA—an extremely low exposure level.

Subsection (d)(2)(iii)(b) further provides that if initial monitoring indicates that employee exposures are below the action level, the employer may discontinue monitoring for those employees whose exposures are represented by that monitoring. Again, please remember that your obligation as an employer under this Standard is a continuing obligation and, therefore, if conditions on the work site change to the extent that the potential exposure to respirable crystalline silica to your employees may change, you are required to do another initial monitoring.

One of the other unique points of this Standard is found under 1926.1153(d)(3), which is titled “Methods of Compliance.” This Section requires that the employer must maintain its employees’ exposure to respirable crystalline silica at or below the 50 micrograms permissible exposure limit (PEL). First, the employer must evaluate the use of engineering controls to reduce exposure. Unless the employer can demonstrate that engineering controls are not technically feasible, the employer is required to implement any engineering controls that will reduce the measured exposure of its employees to respirable crystalline silica to as low of a level as possible. Please note that this Standard is somewhat unique in that it does not permit the employer to make a decision with regard to the effect of engineering controls and then determine whether or not to implement them; the employer is required to implement engineering controls if they provide for any reduction in exposure and only then may the employer rely on personal protective equipment to provide additional exposure reduction.

Section 1153(e)(1) provides that when respiratory protection is required, the employer shall provide each employee with appropriate respirators that comply with the requirements of the Standard, and be in compliance with 1910.134 with regard to the employee’s ability to wear personal respiratory protective equipment.

Section 1926.1153(h) sets out requirements for medical surveillance. Medical surveillance must be made available to each employee (at the employer’s cost) who has been required under this Standard to use a respirator for 30 or more days per year. I suggest that any employers who have employees who meet this requirement offer medical examinations to the employees in writing and maintain a record of the responses of employees to that offer.

Section 1926.1153(i)(2) sets out the information and training requirements for employees under this Standard. Employees are expected to be able to demonstrate knowledge and understanding of the health hazards associated with the exposure to respirable crystalline silica, as well as many other details concerning the employer’s respirable crystalline silica program.

Finally, the employer is required to maintain detailed records, including air monitoring data, for each employee who is exposed to crystalline silica under the Standard. The employer is also required to review and evaluate the effectiveness of its written exposure control plan at least annually and update it as necessary. Again, I recommend that this review and evaluation be performed in writing and be
documented.


Copyright Statement

This article was published in the July 2017 issue of Insulation Outlook magazine. Copyright © 2017 National Insulation Association. All rights reserved. The contents of this website and Insulation Outlook magazine may not be reproduced in any means, in whole or in part, without the prior written permission of the publisher and NIA. Any unauthorized duplication is strictly prohibited and would violate NIA’s copyright and may violate other copyright agreements that NIA has with authors and partners. Contact publisher@insulation.org to reprint or reproduce this content.
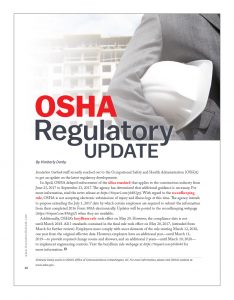
Insulation Outlook staff recently reached out to the Occupational Safety and Health Administration (OSHA) to get an update on the latest regulatory developments.

In April, OSHA delayed enforcement of the silica standard that applies to the construction industry from June 23, 2017 to September 23, 2017. The agency has determined that additional guidance is necessary. For more information, read the news release at https://tinyurl.com/yb8b3grj. With regard to the recordkeeping rule, OSHA is not accepting electronic submissions of injury and illness logs at this time. The agency intends to propose extending the July 1, 2017 date by which certain employers are required to submit the information from their completed 2016 Form 300A electronically. Updates will be posted to the recordkeeping webpage (https://tinyurl.com/k9dcpj2) when they are available.

Additionally, OSHA’s beryllium rule took effect on May 20. However, the compliance date is not until March 2018. All 3 standards contained in the final rule took effect on May 20, 2017, (extended from March for further review). Employers must comply with most elements of the rule starting March 12, 2018, one year from the original effective date. However, employers have an additional year—until March 11, 2019—to provide required change rooms and showers, and an additional 2 years—until March 10, 2020—to implement engineering controls. Visit the beryllium rule webpage at https://tinyurl.com/y8s8e4cl for more information.


Copyright Statement

This article was published in the July 2017 issue of Insulation Outlook magazine. Copyright © 2017 National Insulation Association. All rights reserved. The contents of this website and Insulation Outlook magazine may not be reproduced in any means, in whole or in part, without the prior written permission of the publisher and NIA. Any unauthorized duplication is strictly prohibited and would violate NIA’s copyright and may violate other copyright agreements that NIA has with authors and partners. Contact publisher@insulation.org to reprint or reproduce this content.
A strong and successful safety program is critical for all businesses, particularly those in the construction industry. Of course, it can be difficult to truly implement and sustain a culture of safety that will provide for the ongoing support and protection of all employees. Fortunately, there are a number of resources that can help you create a program that will facilitate the development of an effective safety culture and bolster your health and safety programs.

Essential Elements for Safety Success

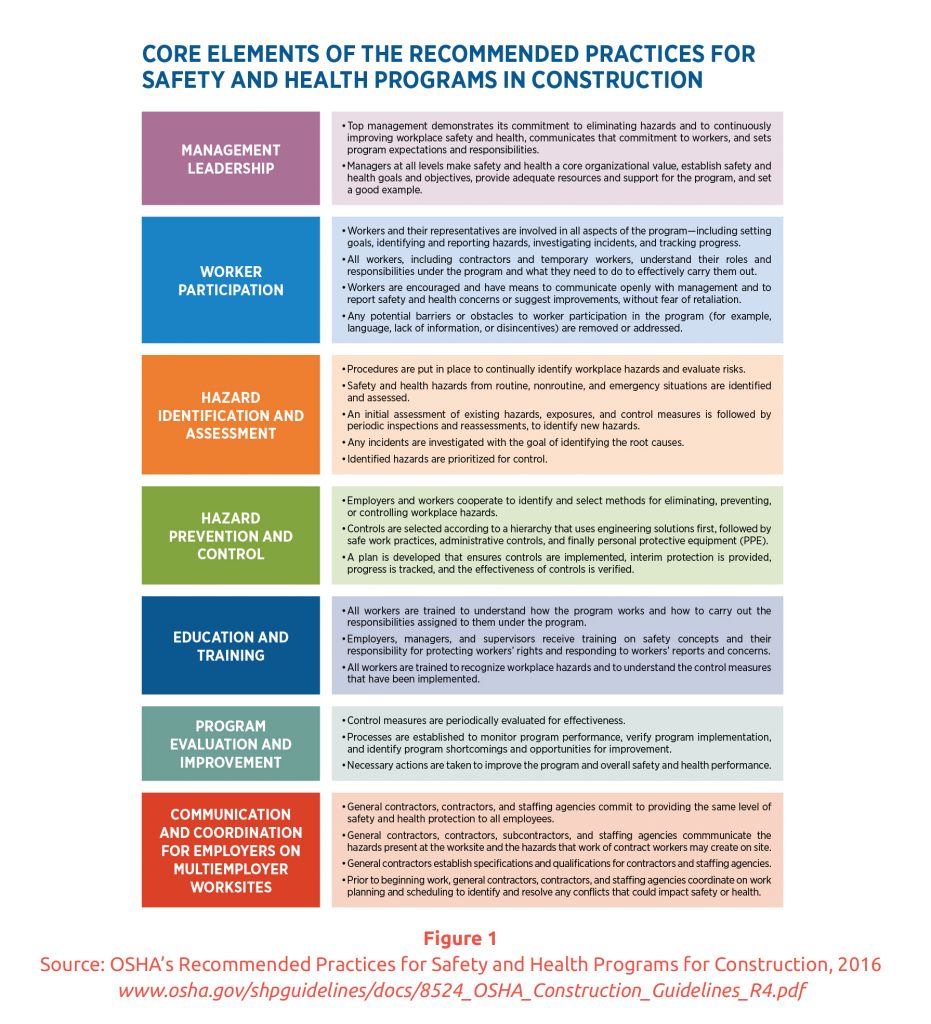
Of the many resources on effective safety management that one can find in a simple online search, the Occupational Safety and Health Administration’s (OSHA’s) “Recommended Practices for Safety and Health Programs for Construction,”1 issued in 2016, perhaps best summarizes the essential elements of a successful safety program. Initially issued in 1989 as “Safety and Health Program Management Guidelines,” this latest version reflects on OSHA’s experiences with successful contractors and others to establish 7 Core Elements for safety and health programs, which is as follows:

Management Leadership

•     Top management demonstrates its commitment to continuous improvement in safety and health, communicates that commitment to workers, and sets up program expectations and responsibilities.
•     Managers at all levels make safety and health a core organizational value, establish safety and health goals and objectives, provide adequate resources and support for the program, and set a good example.

Worker Participation

•     Workers and their representatives are involved in all aspects of the program—including setting goals, identifying and reporting hazards, investigating incidents, and tracking progress.
•     All workers, including contractors and temporary workers, understand their roles and responsibilities under the program and what they need to do to effectively carry them out.
•     Workers are encouraged and have means to communicate openly with management and to report safety and health concerns without fear of retaliation.
•     Any potential barriers or obstacles to worker participation in the program (for example, language, lack of information, or disincentives) are removed or addressed.

Hazard Identification and Assessment

•     Procedures are put in place to continually identify workplace hazards and evaluate risks. Safety and health hazards from routine, non-routine, and emergency situations are identified and assessed.
•     An initial assessment of existing hazards, exposures, and control measures is followed by periodic inspections and reassessments to identify new hazards.
•     Any incidents are investigated with the goal of identifying the root causes.
•     Identified hazards are prioritized for control.

Hazard Prevention and Control

•     Employers and workers cooperate to identify and select methods for eliminating, preventing, or controlling workplace hazards.
•     Controls are selected according to a hierarchy that uses engineering solutions first, followed by safe work practices, administrative controls, and finally, personal protective equipment (PPE).
•     A plan is developed to ensure that controls are implemented, interim protection is provided, progress is tracked, and the effectiveness of controls is verified.

Education and Training

•     All workers are trained to understand how the program works and how to carry out the responsibilities assigned to them under the program.
•     Employers, managers, and supervisors receive training on safety concepts and their responsibility for protecting workers’ rights and responding to workers’ reports and concerns.
•     All workers are trained to recognize workplace hazards and to understand the control measures that have been implemented.

Program Evaluation and Improvement

•     Control measures are periodically evaluated for effectiveness.
•     Processes are established to monitor program performance, verify program implementation, and identify program shortcomings and opportunities for improvement.
•     Necessary actions are taken to improve the program and overall safety and health performance.

Communication and Coordination for Employers on Multiemployer Worksites

•     Host employers, contractors, and staffing agencies commit to providing the same level of safety and health protection to all employees.
•     Host employers, contractors, and staffing agencies communicate the hazards present at the worksite and the hazards that the work of contract workers may create on site.
•     Host employers establish specifications and qualifications for contractors and staffing agencies.
•     Before beginning work, host employers, contractors, and staffing agencies coordinate on work planning and scheduling to identify and resolve any conflicts that could affect safety or health.

OSHA’s discussion on each of these program elements includes the recommended practices for the program, as well as several action items for each.  Each action item is an example of the steps that leaders can take to establish, implement, maintain, and improve a safety and health program.

Leaders looking to improve their organization’s safety programs, and take advantage of the insights of others, would be wise to optimize implementation of these essential elements.

The Importance of Safety Culture

If the essential elements for safety success are the “bones” of a safety program, a proactive safety culture is the “skin” that holds it all together. No single essential element, nor a combination of these elements, will excel without an organizational safety culture in place that is proactive, universal, and continuously improving.

The safety culture concept is based on the notion that organizations have unique cultures—a combination of values, beliefs, and behaviors that define the way they do business. While many definitions for “safety culture” exist in various resources, one that effectively captures the sentiment for contractors is from the Center for Construction Research and Training (CPWR), which states that safety culture encompasses “the deeply held, but often unspoken, safety-related beliefs, attitudes, and values that interact with an organization’s systems, practices, people, and leadership to establish norms about how things are done in the organization.”2

Perhaps one of the earliest known active demonstrations of establishing a safety culture (and instilling management commitment to safety) was with the DuPont Company. Back in the 1800s, DuPont gunpowder mills were plagued by accidental explosions that killed or injured workers with each blast. Patriarch Eleuthere Irenee Du Pont decided to make managers more safety conscious: he relocated their offices directly above the production floor.  This move—for obvious reasons—made them more invested in the prevention of accidents.

The term safety culture may have found its origins after the 1986 accident at the Chernobyl nuclear power plant, the world’s worst nuclear disaster. Explosions at the Ukraine reactor caused at least 30 deaths and contaminated 400 square miles. The International Atomic Energy Agency blamed it on a “poor safety culture” at the plant. Lapses in safety culture have also been cited as part of the reason for the space shuttle Columbia explosion, which killed 7 astronauts and destroyed a $2 billion space shuttle.

Although definitions of what constitutes a good safety culture differ, they all involve focusing on establishing safety as a value within the organization—rather than a priority subject to change depending upon needs, schedules, etc. Leaders who recognize the many benefits of safety and strive to establish a proactive safety culture in their organizations will likely be more successful in leading safety.

What Are Other Leaders Doing?

Whether it’s from our own parents when we have our first child, a coach for a sports team, or a mentor on the job, we can all benefit from the insights provided by someone with experience who knows what works and, more importantly, what doesn’t work. Clearly implementing the essential elements and a proactive safety culture based on the experiences of others are great starting points. Fortunately, for construction leaders looking to improve safety performance, there are other resources to offer insights and reflect on the experience of others. Of those, 2 in particular stand out as most useful for reflecting on what others are doing and what might be needed to be changed to improve safety performance. Both are based on studies and data specific to the construction industry, making them very useful for contractor purposes. Excelling at the “leading indicators” discussed will likely translate into having successful safety programs.

The first resource is a Dodge Data Analytics SmartMarket Report released last year entitled, “Building a Safety Culture: Improving Safety and Health Management in the Construction Industry,”3 which studies safety management in the construction industry. The study and related report examine responses from over 250 contractor companies on 7 categories of Safety Culture Indicators:

1.    Management commitment to safety and health.
2.    Safety and health are fundamental company  values.
3.    Accountability on projects for safety and health.
4.    Worker involvement in jobsite safety and health.
5.    Supervisory leadership on safety and health.
6.    Company communication about safety and health.
7.    Owner involvement in project safety and health.

Notice that at least 2 of the categories (management commitment to safety and health and worker involvement in jobsite safety and health) overlap with our previously discussed essential elements, further establishing these as recognized foundations for safety success.

The study gathered data on 33 leading indicators of a safety culture across these 7 categories as a means to gauge the degree to which construction companies have adopted a strong safety culture. Examples of some of these leading indicators include whether the contractor:

•     Has clearly defined health and safety expectations;
•     Encourages safety and health mentoring;
•     Holds everyone accountable for safety; and
•     Gives workers stop-work authority.

The other valuable resource is a CPWR document entitled “Strengthening Jobsite Safety Climate: Eight Worksheets to Help You Use and Improve Leading Indicators.”4 This document is the culmination of research and is based on 8 leading indicators for safety success:

1.    Demonstrating management commitment.
2.    Aligning and integrating safety as a value.
3.    Ensuring accountability at all levels.
4.    Improving supervisory leadership.
5.    Empowering and involving employees.
6.    Improving communication.
7.    Training at all levels.
8.    Encouraging owner/client involvement.

Once again, there is overlap in what CPWR identifies as leading indicators and what others have established as essential elements needed for safety success.

For each leading indicator, CPWR identifies several “Ideas” that can be assessed, such as “Management should actively participate in all meetings at all levels” and “Supervisors are well-trained, not just on hazards, but also on leadership skills.” Available scores for the leading indicators range from “uniformed” to “exemplary” as a means of benchmarking performance.

Leaders looking to improve their organization’s safety programs could review these or other benchmarking and assessment tools to gain insight into and reflect on the experience of others as to what is needed to improve safety.

Creating a Strong Safety Culture

As with any journey, it helps to start out with a plan (or path) based on where you are and where you want to end up. If achieving an excellent safety culture is your goal, it will take commitment at all levels of your organization, starting at the top. Management commitment is the number one leading indicator of a strong safety culture.

However, it can be challenging for leaders to know how to start or where to go for help in managing safety. Fortunately, as evidenced in this article, there are many useful resources available for those willing to take the challenge on themselves. There are also third-party resources that can assist, including trade associations, insurance carriers, and safety consultants. Companies are increasingly hiring third party safety consultants to help assess and develop their safety programs and manage the journey to generating a truly exceptional safety culture.

A truly exceptional safety culture ensures that safety is a priority not just when incidents arise, but at all times. Striving to achieve this type of culture is a necessity for any high-performing business.

References
1. OSHA’s “Recommended Practices for Safety and Health Programs for Construction,” www.osha.gov/shpguidelines/index.html, 2016.
2. Center for Construction Research and Training, www.cpwr.com, 2017.
3. Dodge Data Analytics, SmartMarket Report, “Building a Safety Culture: Improving Safety and Health Management in the Construction Industry,” www.construction.com/toolkit/reports/building-a-safety-culture, 2016.
4. Center for Construction Research and Training, “Strengthening Jobsite Safety Climate: Eight Worksheets for Help You Use and Improve Leading Indicators,” www.cpwr.com/sites/default/files/research/Safety_Climate_Workbook_and_SCAT_092116.pdf, 2015.


Copyright Statement

This article was published in the July 2017 issue of Insulation Outlook magazine. Copyright © 2017 National Insulation Association. All rights reserved. The contents of this website and Insulation Outlook magazine may not be reproduced in any means, in whole or in part, without the prior written permission of the publisher and NIA. Any unauthorized duplication is strictly prohibited and would violate NIA’s copyright and may violate other copyright agreements that NIA has with authors and partners. Contact publisher@insulation.org to reprint or reproduce this content.

When Rachael Sobon, SHRM-CP, started her job as the first human resources (HR) professional at CRP Industries 10 years ago, she quickly saw room for improvement.

Sobon understood that the daily deadlines of a bustling warehouse required many of the Cranbury, New Jersey–based company’s 180 workers to be onsite at certain hours. However, she also believed that some policies at CRP, a third-generation family business that distributes after-market auto parts, were too rigid for the company’s own good.

“We had a lot of attendance issues,” Sobon recalls. Because there was no provision for taking just an hour or 2 off at a time, employees would often take a sick day to run errands or go to routine appointments. Many would use up their time off by summer, so when the holidays rolled around, they took leave without pay. “That hurts the business when we can’t schedule out the manpower,” Sobon says.

Decades-old policies intended to ensure proper staffing levels were backfiring, Sobon says. So, with support of the company’s President, she introduced a paid-time-off policy that allows employees to take accrued leave in half-hour increments. “Whether they’re sick or going to a school play or the cable person is coming—it just gives them flexibility so they’re not stuck in a situation where they have to pretend they’re ill or make up a story,” she explains.

Sobon also rolled out an option for employees to work a compressed, 4-day schedule in the summer and take part in staggered work shifts starting between 6:30 and 9:00 a.m., depending on the requirements of the job. And because workers are cross-trained in all the warehouse positions, they can move from one role to another as needed.

Within a year of implementing the changes, “we basically stopped writing warning letters for attendance,” Sobon says. “Fast-forward 10 years, and we have everything online—all of our warehouse employees use the app on their phone, so on a Saturday or Sunday if something comes up, they can put in a request through our system to say, ‘I’m going to be off a few hours on Monday morning,’ giving that manager a little bit of a heads-up.”

Over the past decade, the drumbeat has been growing louder for more flexibility in the U.S. workplace. Driven by demand from Millennials—who now represent the largest generation in the labor force—many employers are offering a range of scheduling options to attract and retain top talent in a competitive employment market. According to the Families and Work Institute’s (FWI’s) 2014 National Study of Employers, more than 80% of employers with at least 50 workers allowed at least some employees to take paid time off for personal and family needs or to periodically change when they start and end the workday.

Yet experts say there’s a gap between companies’ stated policies and their willingness to embrace flexibility in practice, particularly for individuals in blue-collar occupations—jobs that often involve manual labor and tend to pay by the hour.

According to FWI President Ellen Galinsky, blue-collar workers are much less likely to have such flexibility—“which is sad,” she says, “because [they] need it most.” After all, working-class employees tend to be those who can least afford child care and are more likely to be balancing a second job or classes to advance in their careers. Some obstacles seem inevitable: Plumbers and electricians can’t ply their trades from home, for example, and certain roles will always need to be filled at fixed times—such as bus drivers during the morning rush hour.

Yet as Sobon’s experience at CRP Industries shows, those realities don’t render all forms of flexibility impossible. Indeed, HR professionals can lead their companies in rethinking long-held assumptions about the scheduling of blue-collar workers. Doing so can benefit both employees and the business.

Good for Business

That has certainly been true for Badger Balm, a manufacturer of natural body care products with 90 employees in Gilsum, New Hampshire. The company offers many benefits geared toward work/life balance, most notably its Babies at Work program, which allows new parents to bring their infants onsite.

When people ask Emily Hall Warren, SHRM-SCP, the company’s Director of Administration, about the business case for such generous policies, she is quick to reframe the question. “We don’t do it for return on investment—we do it because it’s the right thing to do for people,” she says. As a certified B Corporation recognized for its ommitment to social and environmental issues, Badger Balm aims to do more than just maximize shareholder value.

That said, Hall Warren touts the benefits to the bottom line as well. “The retention rate is phenomenal”—the company’s annual attrition a mere 7.2%, she says—“and our recruiting costs are almost nothing.”

That’s because Badger Balm attracts employees, particularly Millennials, who are driven to work for organizations that they believe are making a difference in the world and that optimize their quality of life. “We get overqualified employees who want to work here for those reasons,” Hall Warren says, adding that 20% of staff in the shipping department have graduate degrees.

Retention is generally the top reason employers give for developing policies around flexibility or dependent care, according to FWI research. According to the institute’s 2008 survey results, which represent the most recent data available, 39% of employers with at least 8 flexibility initiatives in place said their primary reason for offering the policies was “to retain employees,” and 15% said it was “to recruit employees.”

Allowing employees some degree of control over their schedules can also reduce unplanned absences, as the managers of Globe Firefighter Suits discovered 9 years ago. That’s when the 430-employee manufacturer of emergency response uniforms gave its workers flexibility in their start times.

But how can you keep an assembly line moving if some people start at 6:00 a.m. and others don’t arrive until 2 hours later?

“That was our objection for 120 years: We were concerned that there’d be a bottleneck somewhere,” says HR Manager Gayle Troy, who has worked at the Pittsfield, New Hampshire–based company for 31 years. “What we finally wrapped our brains around—and it was difficult to get there—is if a particular employee’s job is setting sleeves on fire suits and she comes in later than everybody else, she’ll come in to some work piled up at her workstation, but she’ll finish it by the end of the day. So it works.”

Most employees at Globe still opt to start at 6:00 a.m. so they can finish by 2:30 p.m.—in time to meet the school bus or tend to other responsibilities or just enjoy more free time during the day. But being given a choice is a big morale booster, and the workers are happier overall and less likely to quit than they were before. The company also offers a flexible time-off policy that has decreased absenteeism.

At Softstar Shoes, a maker of handcrafted “minimal footwear” based in Philomath, Oregon, at least one-third of the 28 employees work part time. The company offers flexible start times and leeway to leave in the middle of the day—major selling points in attracting workers, many of whom have hobbies or side businesses in other crafts, says HR Manager Sarah Mason.

“When I hire people, I tell them that, although they will never become millionaires working here, one of the biggest benefits is the flexibility that comes with the job, and also loving your work,” she says.

Market Forces

So why haven’t more employers with blue-collar workers adopted such policies? In many cases, they simply haven’t needed to. Companies are generally most willing to integrate flexibility options for occupations where there is a labor shortage, according to the research of Ellen Kossek, a Professor of Management at Purdue University’s Krannert School of Management. Although there will always be a cost to hiring new employees, going the extra mile to retain workers becomes more important when there isn’t a long line of applicants ready to replace them. “That’s why you see more experimentation in nursing than construction—because of the shortage of workers in nursing,” Kossek says.

Meanwhile, income pressures induce workers to put in more hours than they might otherwise prefer, says Peter Berg, a Professor at Michigan State University’s School of Human Resources and Labor Relations. “If blue-collar workers find that their wages have been stagnant for the last several years”—as, in fact, they have been—“that makes it more valuable to take the hours and work Saturday or Sunday,” earning time and a half on top of 40 hours of straight-time pay.

Unfortunately, however, employees often don’t have a choice, particularly in non-union jobs, as the employer can mandate extra hours. “When the boss says, ‘I need you to stay on for the next shift,’ that’s a real schedule flexibility killer,” Berg says.

Even in union shops, where collective bargaining gives workers some clout, work/life balance and flexibility might take a back seat to other issues deemed more important in union negotiations with management, like wages and health benefits, Berg points out.

And advances in scheduling software have generally not been a friend to workers, especially in the retail and service industries. Store and restaurant managers have always tried to control labor costs by staffing up or down to match the peaks and valleys of customer demand. “But now there’s technology that lets retailers look at minute changes in demand and make adjustments much closer to that time than they have in the past,” explains Susan Lambert, a Professor at the University of Chicago’s School of Social Service Administration who studies people working in low-skilled, hourly jobs. “Variations in work hours in hourly jobs look very much like instability rather than flexibility,” she explains.

Moreover, employees must balance any freedom they have to turn down shifts against their need to make a living wage. “If you say you can’t work Tuesday afternoons, you’re not scheduled for that time—but that doesn’t mean you will be scheduled for when you can work,” Lambert says. The result can be a system that pits workers who can be available at a moment’s notice against those who need more flexibility. “People with outside responsibilities—students, people with children—are at a loss in this competition for hours,” she concludes.

A Role for HR

HR professionals are in a good position to find flexible solutions that meet the needs of both employers and workers. A good place to start is by auditing your company’s scheduling practices, which can reveal startling gaps between written policies and reality. For example, when are schedules published for employees to view? How much do hours vary week to week? What percentage of workers want more hours, and what proportion work different hours and days each week? “Corporate people are often quite shocked to know how unstable and unpredictable the jobs are,” Lambert says.

One reason for the disconnect between what’s on paper versus what’s being practiced is that companies typically put far more effort into writing policies than in implementing them. For example, Berg says most supervisors he has interviewed have received no training on how to manage issues related to work/life balance. As a result, they don’t know what options they can offer to employees in different situations.

By providing tools for implementing flexibility, HR can help managers deliver on the company’s good intentions, communicating to employees that the organization genuinely cares.

Training supervisors is also a good way to overcome the “Mother, may I?” effect, which can occur when policies put the onus on workers to ask for flexibility. “Employees feel that ‘You might have a policy on the books, but if I take it you’ll see me as a lesser worker,’” says Brigid Schulte, author of Overwhelmed: Work, Love, and Play When No One Has the Time (Sarah Crichton Books, 2014) and Director of the New America Foundation’s Better Life Lab. “There are a number of places that have put policies in place—but they haven’t figured out how to imbue the culture with an acceptance of those policies.”

One large retailer that does seem to have figured it out is The Container Store, based in Coppell, Texas, which last year secured the No. 14 spot on Fortune’s list of 100 Best Companies to Work For. All of its 5,000 employees nationwide, including the many part-time workers at the company’s 86 stores, receive at least 30 hours of training—not just on the nuts and bolts of their jobs but also on the company’s “employee first” culture, which prizes communication, says Karyn Alvarez, Director of Recruiting.

Clear communication starts during hiring.

Managers are upfront about current business needs, and prospective employees share their needs and hopes. When you have that 2-way conversation, “there’s not a lot of surprises after the fact,” Alvarez says.

As workers’ lives change, managers keep the lines of communication open and work to accommodate employees’ scheduling needs as much as possible. “Maybe they’re a student in college, and one semester they have all morning classes and they ask their manager to work afternoons or evenings, and then next semester it flip-flops,” Alvarez says. The supervisor is receptive to the request because she knows it’s coming from a good employee in whom the company has much invested.

This kind of give-and-take suggests that The Container Store has at least one quality that Kossek and her colleagues have identified in organizations that implement flexibility initiatives effectively: Employees feel that the organization supports their personal lives.

The company uses Kronos—the same software that some companies use to generate crazy-making schedules—but leverages the technology to plan workers’ timetables several weeks out, matching projected sales with who is available to work when. It also pays its hourly employees 50% more than the retail industry average.

While there is no doubt that these efforts come with a significant price tag, Alvarez says they have paid off in the form of a happier and more productive workforce. “It’s a win-win situation,” she says. “What I’ve heard time and time again is that our employees appreciate the time and attention our managers put into store schedules, trying so hard to fit the needs of the business and the employee together.”


Reprinted from Society for Human Resource Management, March 20, 2017, with permission of the Society for Human Resource Management (SHRM). ©SHRM 2017. All rights reserved.


Copyright Statement

This article was published in the July 2017 issue of Insulation Outlook magazine. Copyright © 2017 National Insulation Association. All rights reserved. The contents of this website and Insulation Outlook magazine may not be reproduced in any means, in whole or in part, without the prior written permission of the publisher and NIA. Any unauthorized duplication is strictly prohibited and would violate NIA’s copyright and may violate other copyright agreements that NIA has with authors and partners. Contact publisher@insulation.org to reprint or reproduce this content.
Boiler insulation practices have moved from a single layer to a dual layer of the same total thickness in recent years. However, this dual layer trend has a downside: higher installation costs and the potential for inexperienced contractors or self installers to cut corners when installing insulation. It’s time to return to using single layer insulation on power boilers and employing professional insulation contractors.

The construction of new steam-generating boilers has been slowed in part by today’s economic environment and regulatory uncertainty. Although not tracked by the National Energy Technology Laboratory (NETL), rising construction costs—now over $1 billion for a moderately sized new plant—can play a significant role in delaying the start of a new project.

The central building block of any new fossil fuel–fired plant is the boiler island. Every possible means should be explored to lower the construction cost. One particular means to reduce the cost of the construction is improving the insulation on steam-generating boilers.

Many in the power industry believe that a smarter and more economical insulation design on steam-generating boiler walls should be explored, especially when considering the rising cost and reduced availability of qualified field labor. One specific way to reduce costs is to use or to specify a single layer of insulation.

Today, the power industry accepts the assertion that a double layer application in lieu of one single layer of insulation on membrane boiler walls creates a better insulation system.

That, however, is not always the case. Single-layer application on membrane boiler walls was a common practice within the power industry for many years. In fact, almost every boiler built between 1968 and the middle 1980s in the United States, regardless of the manufacturer, specified single-layer application for their boiler wall insulation unless the thickness required by operating and surface temperatures was greater than 4 inches (assuming a mineral wool board type insulation). Double layer application during that time was typically specified only when it was a special requirement by the end user or the insulation material was not available in a single layer by the insulation manufacturers.

In designing a boiler, the Original Equipment Manufacturer (OEM) must establish the cold-surface temperature, or acceptable heat loss, on the boiler walls. This temperature typically ranges from 120°F to 140°F, although many accept 130°F as an industry standard today. Next, the heat loss on the boiler walls at that temperature and the boiler casing temperature (based on the size of the boiler and superheater surface required to meet a desired steam outlet and exit gas temperature) is used to calculate the thickness of a given insulating material. Then the distance between the boiler water wall tubes and the buckstays (integral structural support of the boiler) is set to accommodate the insulation thickness.

The boiler warranty is often tied to how close the OEM meets the specified cold surface temperature, steam outlet temperature, and gas outlet temperature. Therefore, the insulation specifications selected by the OEM and the proper installation procedures are very important in determining the final boiler performance. That is why every aspect of the insulation selection (such as material and installation cost, K-value at mean temperature, shrinkage, and material thickness availability, etc.) must be closely analyzed.

All boiler manufacturers specify and document the insulation thickness and material requirements on their steam-generating boilers. Each has developed company standards for the type of insulation and the acceptable application procedures for installing the insulation. These standards and application procedures are provided with each boiler they sell whether the insulation was in their scope of supply or not. This is still true today.

The decision to use a single or double layer of insulation during construction of the boiler is not tied to the boiler performance warranty. In fact, for a given surface temperature and boiler wall temperature, the boiler performance is not affected by the number of insulation layers installed on the boiler walls as long as the total thickness was the same. In other words, it doesn’t matter if a single or double layer of insulation is specified—the total thickness is what governs insulation performance. The decision to specify single layer over double layer is strictly an economic decision made by the OEM.

Single-thickness insulation has a long and successful history in the power generation industry. During the period from 1964 (starting with the membrane tube wall construction) to 1990, one particular boiler manufacturer built and sold over 250 radiant power boilers, 150 universal pressure boilers, 200 industrial boilers, and 100 process/Kraft recovery boilers. All of these boilers were designed and constructed with a single layer of mineral wool board on the boiler walls and a cold surface temperature of 130°F. Significantly, neither the OEM nor the power plants have reported any problems meeting boiler performance caused when using only a single layer of insulation on all of these units.

Costly Changes

In the mid-1990s, several OEMs and purchasers changed their insulation standard to require a double layer of insulation—with the same overall thickness—on their boiler walls. The reasons behind this specification change remains murky to many of those who work within the industry designing and specifying insulation systems.

If this change was made as an energy-saving decision, then 1 layer will perform as well as 2 layers at the same overall thickness, assuming the insulation is installed correctly by a professional insulation contractor.

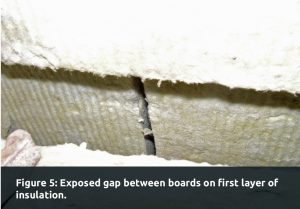
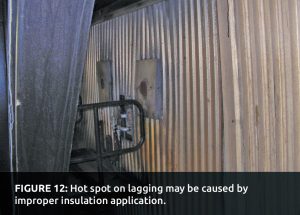
Some argue that a double-layer application is better than single layer because it eliminates gaps between the individual insulation pieces and reduces the chances for hot spots on the outer lagging or casing surface. This is a labor supervision issue and not a design specification issue. Every OEM installation standard clearly states that gaps 1/16” or greater between boards or blankets are not acceptable regardless of how many layers of insulation are being installed. These standards require that all insulation be tightly butted against each other and any gaps between insulation must be filled with appropriate insulating cement before the outer lagging or casing is installed. These standards are independent of whether the insulation is applied in a single or double layer.

Using a double layer of insulation has several drawbacks. First, the cost to use double layer versus single layer insulation on boiler walls increases the cost of material for additional fasteners and labor. For example, a boiler with 100,000 square feet of water wall surface covered with a 4-inch-thick double layer mineral wool board meeting ASTM C-612 type IVB—in lieu of a single board of the same thickness—raises the cost to build that boiler by approximately $200,000 (this will vary depending on region and labor market). For the 22 new coal-fired units built in the last 10 years, this could amount to over 4 million dollars in increased construction cost.

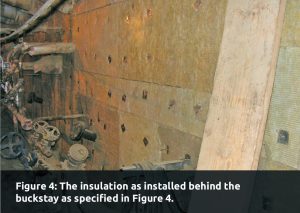
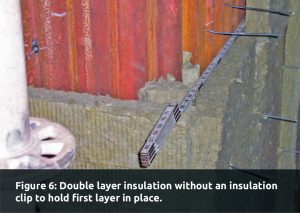
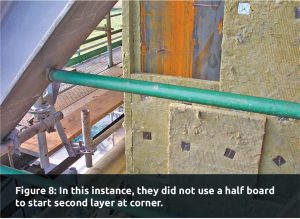
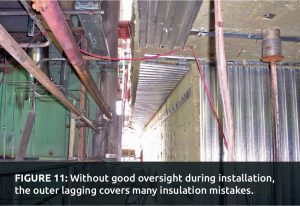
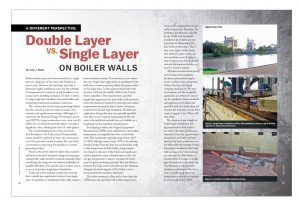
Also, going to a double layer often increases the number of gaps and can increase the incidence of improper insulation applications. This situation takes place when the first layer of insulation is installed in an improper manner followed by the second layer that forever hides the poor craftsmanship—this is part of why hiring an experienced, qualified, and knowledgable contractor (such as one of the National Insulation Association’s members) is so important. Unfortunately, with self-installers this occurs all too frequently and only good contractors and supervisors will prevent this situation from becoming an epidemic on a job site. Figures 5–12 illustrate how the improper installation of a double layer of insulation occurred during construction of a power station. Each of these photos violates the OEM installation specification.

Final Thoughts

There is a time and a place to use double layers of insulation. For example, double layers are appropriate when burying external stiffeners and channels, or where the hot face temperature requires more than 4 inches of insulation to maintain a given cold face temperature. These situations are atypical and can easily be handled in the field as exceptions.

The increased cost of applying 2 layers of insulation plus the increased instances of poor insulation performance caused by poor field supervision and inexperienced installation labor does not support the current industry trend toward double layers of insulation.


Copyright Statement

This article was published in the June 2017 issue of Insulation Outlook magazine. Copyright © 2017 National Insulation Association. All rights reserved. The contents of this website and Insulation Outlook magazine may not be reproduced in any means, in whole or in part, without the prior written permission of the publisher and NIA. Any unauthorized duplication is strictly prohibited and would violate NIA’s copyright and may violate other copyright agreements that NIA has with authors and partners. Contact publisher@insulation.org to reprint or reproduce this content.

Every 2 years, the National Insulation Association (NIA) conducts a survey to gauge the size of the mechanical insulation and laminated metal building insulation industry segments. This survey began in 1997 to gain data about the size of the mechanical insulation industry, which had not been measured before that time, and added the laminated metal building insulation segment in 2013. The survey is sponsored by NIA’s Foundation for Education, Training, and Industry Advancement, and aims to provide valuable data regarding market size and growth rates for the U.S. commercial and industrial mechanical and laminated metal building insulation markets. The survey goes out to NIA’s Associate members, who are manufacturers of insulation products or insulation accessories. The survey asks those members to provide information about their sales volume, and then a third-party company—using this information and formulas created by NIA—determines the annual size of the respective U.S. insulation industry segments.

Mechanical Insulation Industry

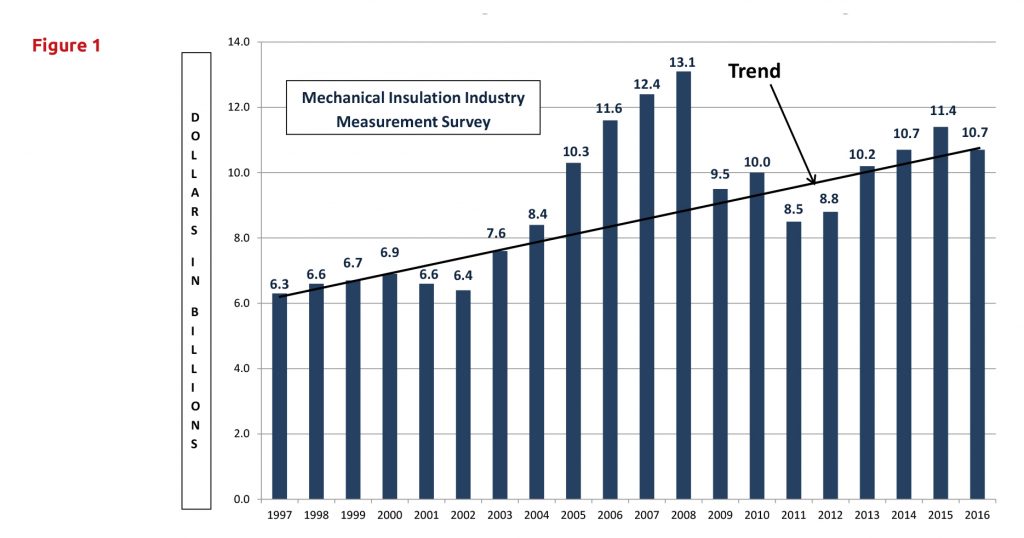
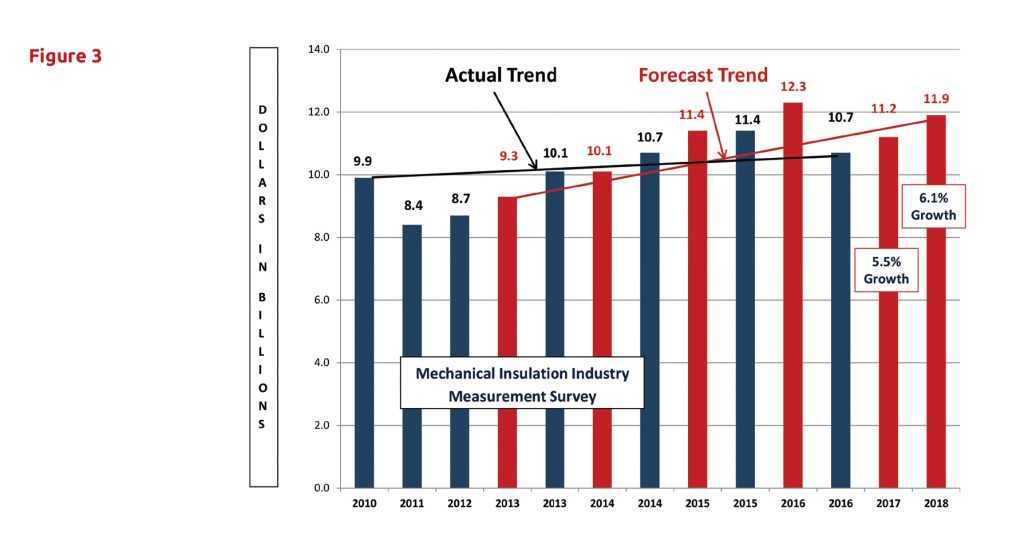
The latest mechanical insulation industry survey was created and administered in the first quarter of 2017 to look at growth from 2015–2016 and to forecast future growth in 2017–2018. In summary, the survey indicated the market is basically flat over the 2014–2016 period. 2015 saw an increase of 6.1%, while 2016 experienced a decrease of 5.9%. Growth in 2017 and 2018 is forecast at 5.5% and 6.1% respectively. The United States mechanical insulation industry, which reached $10.7 billion in 2016, is forecast to reach $11.9 billion in 2018.

Findings

As we have seen with past surveys, industry growth is not uniform across market segments, the country, by region, state, or even within states. Figure 1 exhibits the industry growth trend over the last 19 years (1997–2016).

While the survey process does not provide a breakdown between what is generally referred to as the commercial and industrial market segments, informal analysis indicates the commercial market experienced growth in 2015 and in 2016. The industrial market, on the other hand, experienced a decline in both years. That decline was led by the significant drop in oil prices, reduced activity in the power industry, and the other contributing market factors that have been reported over the last 2 years.

In an effort to gain a more complete picture, NIA also conducts an informal survey regarding sales margins among distributors and contractors. The survey indicated that on a national basis, there was minor gross margin improvement in both the distribution and contractor channels. However, more significant gross margin swings were reported with this survey than with more recent surveys. Margin erosion was reported in some commercial and industrial geographical markets. This is not an uncommon occurrence when revenue opportunities are less abundant.

With widely fluctuating margins at the distributor and contractor levels, it is a good assumption that the manufacturing segment also experienced similar swings, though we cannot know for certain since the survey looks exclusively at manufacturing sales volume.

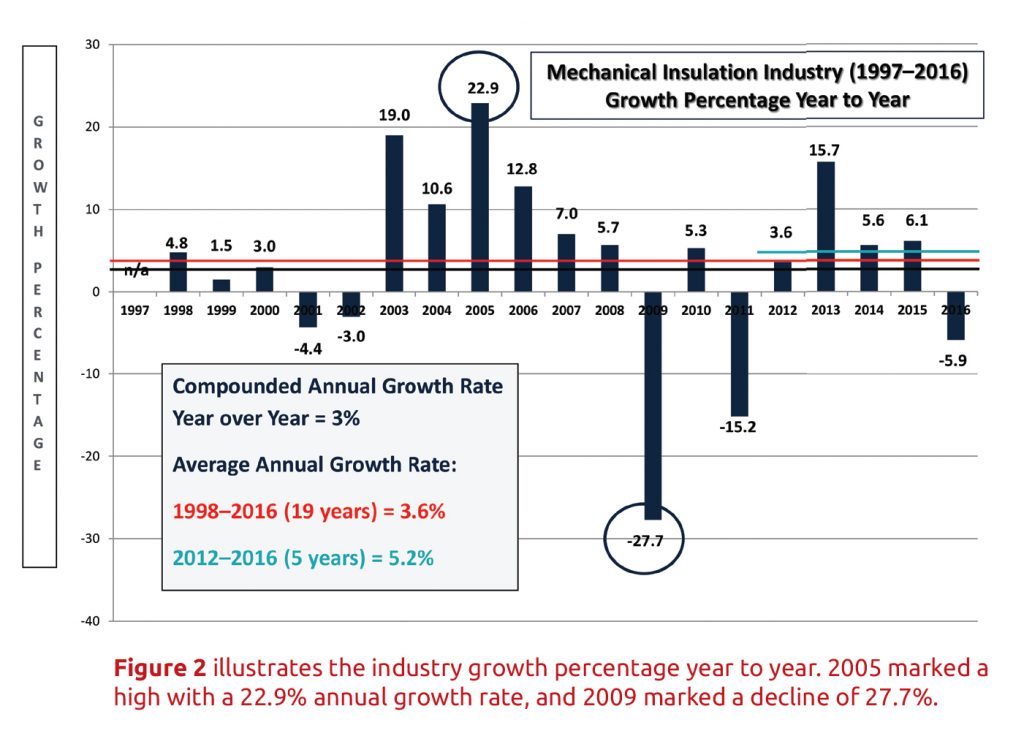
Figure 2 illustrates the industry growth percentage year to year. 2005 marked a high with a 22.9% annual growth rate, and 2009 marked a decline of 27.7%. Annual fluctuations are to be expected and are caused mainly by changes in the overall economy. When analyzing the data in comparison to the economy, you need to take into consideration that, due to construction cycles, the industry typically trails the economy between 9 and 15 months. The compounded annual growth rate—which refers to industry growth over the entire 19-year period—is 3%, while the average annual growth rate over that period is 3.6%. The average growth rate over the last 5 years is 5.2%.

Beginning with the 2013–2014 survey, the survey respondents provided their forecasted growth over the preceding 2 years. The current survey indicates an expected average industry growth of 5.5% in 2017 and 6.1% in 2018. Actual industry results were at or above forecasted levels with the exception of 2016. That difference is believed to be primarily attributable to the industrial segment and the unforeseen decline in oil prices.

It is important to note the 2016 and 2017 forecasts varied greatly, ranging from 0% growth to 15%. Growth was expected in both units and dollars (price increases). On average, 62% of the 2017 growth forecast was derived from unit growth while 2018 was split 50/50 between unit and dollar growth. Unfortunately the survey methodology does not allow for differentiation of those increases by market segment.

The 2014 survey respondents indicated that they expected a 7.0% increase in 2015 over 2014 and a 7.3% increase in 2016 over 2015. The actual results were 6.1% and -5.9%, respectively. In dollars, the projected and actual market size was $10.7 billion in 2015. For 2016, the projected market was size was $12.7 billion, but the actual was $10.7. If growth expectations are achieved through 2018, the industry size will be $11.9 billon.

For the 4 year period (2013–2016) actual growth exceeded or met forecast 3 of the 4 years. If you consider the 2013 forecast in relationship to the 2018 forecast, the forecasted compounded growth rate would be 5.6%. Assuming the actual for 2017 and 2018 are at forecasted levels, the actual compounded growth rate would also be 5.6%.

The recent survey also exhibited a lower ratio of accessory materials in comparison to primary core insulation materials. It is believed this decrease is indicative of the decline in the industrial market for more expensive finishing systems that are traditionally utilized in that market.

Facility or shop fabrication labor and related accessories/consumables have been included in this survey, whereas in past surveys, they had been excluded. That addition had less than one tenth of a percent (.1%) impact on the results. All previous survey results have been adjusted to include a similar impact.

Survey Methodology and Assumptions

Survey results are always subject to individual interpretation. Following is some information about the survey and some potential takeaways that have been developed in conjunction with conversations before and after the tabulation of the survey data.

•     The survey is based upon dollars, not units, and a consistent approach has been utilized over the 20 years (1997–2016). Based on the survey methodology, the results should represent a conservative number.
•      The survey does not include data related to metal building insulation; heating, ventilating, and air-conditioning (HVAC) duct liner; original equipment manufacturer products; building insulation; residential insulation; refractory products; other specialty insulations; or insulation products or technologies not currently encompassed in NIA’s scope of mechanical insulation products. The potential impact of imported products outside North America, which is believed to be minimal, has not been included. The survey excludes major project scaffolding and similar type project requirements. Informal surveys were conducted to determine margins and labor and material ratios. Variations in those results could affect the total insulation market estimate.
•      Insulation products include any/all accessory products when sold as an integral part of the manufacturer’s products (i.e., all-service jacket [ASJ] or other facing on blanket, board, or pipe covering).
•      The survey is intended to show a “national” picture for the respective calendar year. Based upon observations and conversations, there are significant geographical and product variances to the survey results. This is not inconsistent with any survey of this broad nature.
•      The 2017 and 2018 forecasts seem to be reasonably in line with overall commercial and industrial construction market forecasts. The forecast does not break out growth expectations between the commercial or industrial market segments or between new construction, retrofits, and/or maintenance applications. Historically, a forecast of this nature includes a blend of these applications with new construction being the largest percentage. Regardless, the growth forecasts are welcome news and some believe they may be conservative.
•      Unfortunately, the survey methodology does not allow for interpretation between the commercial and industrial market segments, or between type of applications, contracts, or product types. The survey also does allow for any analysis as to whether the increases or decreases were led by unit or dollar growth.
•      The Foundation always requests survey participants to share detailed information about the insulation industry, but many are only willing to share general information, rather than detailed segment or business information. In addition, many products are fabricated into different shapes and shipped to various locations for use in multiple industry segments, which makes reporting or forecasting by industry segment difficult.

Looking Forward

The mechanical insulation market continues to exhibit compounded growth over an extended period. While some market segments may fluctuate year over year and occasionally the overall market may experience a decline (as it has 5 times since 1997), the industry as a whole has experienced a 3% compounded annual growth rate over 19 years and 5.1% growth rate over the last 5 years (2012–2016). As unpredictable and vulnerable to outside influences as the commercial and industrial construction industry seems to be, those compounded growth rates indicate the mechanical insulation industry is standing the test of time.

The Laminated Metal Building Insulation Industry

As previously mentioned, NIA has been conducting an industry-measurement survey for the mechanical insulation market since 1997. Laminated metal building insulation was excluded from that survey because it could not be applied to the survey methodology utilized for mechanical insulation. With the help of several metal building laminators, an approach and methodology for laminated metal building insulation was developed and data for this industry segment was collected for the first time for 2013.

The survey’s goal is to provide valuable data regarding market size and growth rates for the U.S. laminated metal building insulation market. The NIA members who participated in the survey provided information to an independent third-party company. The company took that information and applied a formula created by NIA to extrapolate the annual size of the laminated metal building insulation industry in the United States. The latest survey was conducted in the first quarter of 2017 to determine industry growth from 2015 through 2016 and to obtain an indication of growth for 2017 and 2018.

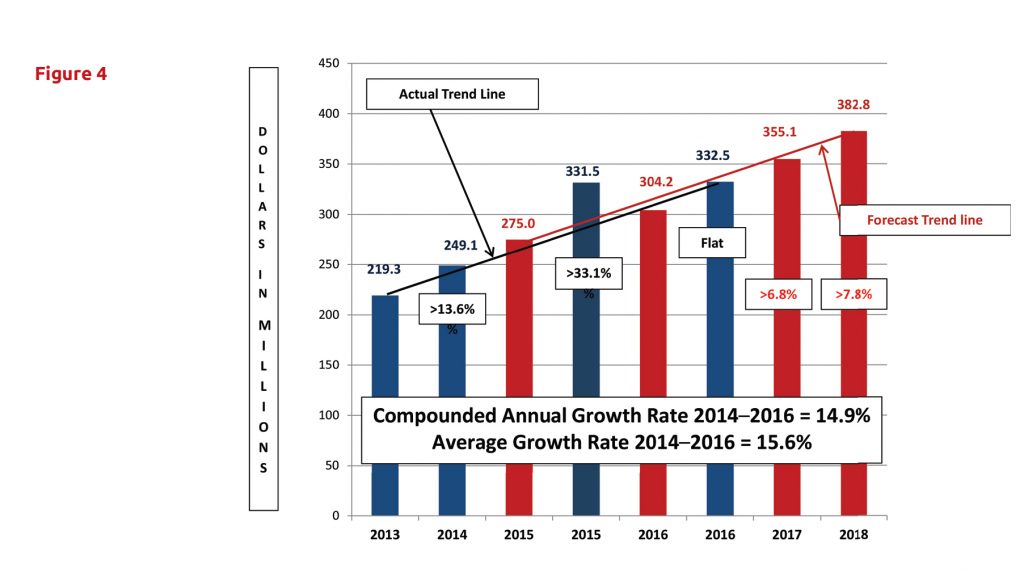
Survey results indicate that the market is continuing to grow. As shown in Figure 4, the U.S. laminated metal building insulation market exceeded $331 million in 2015 (a 33.1% increase over 2014) and grew slightly in 2016 to $332 million. The market is forecast to reach $355 million in 2017 (a 6.8% increase over 2016), and over $382 million in 2018 (a 7.8% increase over 2017).

The average actual annual growth rate since 2013 is 15.6%. The compounded annual growth rate since 2013–2016 equals 14.9%. If actual results equal the 2017 and 2018 forecast, the compounded growth rate from 2013 (6 years) will equate to 11.9%. Those rates are worthy of envy from many industries.

The survey included the following general definition for laminated metal building insulation products: all fiber glass insulation products and jacketing products sold by manufacturers for use in developing (fabricating/laminating) laminated metal building insulation systems. Using informal survey methods, the following were added to develop the final survey results: lamination accessory materials (adhesives, packaging, etc.), laminating labor, laminator margins, and delivery costs. The intent was for the survey to represent only laminated metal building insulation, but the methodology employed may have captured some allowance for liner-type products.

It is important to note that survey responses in regard to 2017 and 2018 forecasts varied from 3% growth to 10%. Overall growth was expected in both units and dollars (price increases). On average, approximately 50% was from unit growth, which illustrates core industry growth or increased demand for products and services.

Survey results are always subject to individual interpretation. The following is some information about the survey and some potential takeaways that have been developed in conjunction with conversations before and after the tabulation of the survey data.

•     The survey is based upon dollars, not units, and a consistent approach has been utilized. Based on the survey methodology, the results should represent a conservative number. The survey does not include all of the various products utilized in the metal building insulation market nor has the potential impact of imported products outside North America been included.
•     The survey is intended to show a national picture for the respective calendar year. Based upon observations and conversations, there are significant geographical and product variances to the survey results. This is not inconsistent with any survey of this broad nature.
•     Based upon an informal survey, it was felt that while laminator/fabricator margin variances varied geographically, the overall national average margin had not changed since the previous survey, nor had the ratio between the core insulation and jacketing materials.
•     Mechanical insulation and building insulation, including all accessory products, are excluded for the purposes of this survey.
•     The 2017 and 2018 forecasts seem to be reasonably in line with the overall commercial construction market forecast. The forecast does not break out growth expectations between new construction, retrofits, or maintenance applications. Historically, a forecast of this nature includes a blend of each with new construction being the largest percentage. Regardless, the growth forecasts are welcome news.

Conclusion

The laminated metal building insulation market continues to sustain annual growth without regard to the fluctuations in the economy. If that trend continues, the industry could reach the $500 million level by 2020.


Copyright Statement

This article was published in the June 2017 issue of Insulation Outlook magazine. Copyright © 2017 National Insulation Association. All rights reserved. The contents of this website and Insulation Outlook magazine may not be reproduced in any means, in whole or in part, without the prior written permission of the publisher and NIA. Any unauthorized duplication is strictly prohibited and would violate NIA’s copyright and may violate other copyright agreements that NIA has with authors and partners. Contact publisher@insulation.org to reprint or reproduce this content.
The History of Steam Power

Steam power has a long and important history. It has powered an industrial revolution, supported the growth of our largest cities, and shaped the political maps of our world. Yet, for many, it goes unnoticed.  Steam warms our homes and workplaces in winter, and even cools us in summer. Steam also provides the energy to support industrial, medical, commercial, and manufacturing operations around the globe.

Even though steam power has been used since the first century, it really didn’t make its mark on the world until it was used in London in 1698. The idea of harnessing steam power hasn’t changed for centuries, but the technology behind it has. Since the first metropolitan steam network commissioned in New York in 1882, the industry has witnessed incredible technological advances in generation, transportation, and control. Unrelenting demand for quality, reliability, and efficiency have increased the pressure on operators to maintain resilient networks, and the steam community has responded with innovation and advancements. However, even with all the improvements in technology and system design, a key element of today’s steam networks has remained relatively untouched: thermal insulation.

The role of thermal insulation in a steam network is quite simple: maintain the desired steam quality, protect the asset and infrastructure from environmental conditions, and safeguard those who interact with the network, including maintenance personnel and the general public. Those of us in the insulation industry know that when insulation works, it goes unnoticed. When it fails, however, the consequences can be severe.

Insulation may not be the most interesting of efficiency-enhancing measures, but it is the unsung hero in our modern world. Unfortunately, insulation’s contribution to safe and efficient operations is sometimes overlooked in favor of more “advanced” technologies.  Whereas a new, more reliable model of steam trap or a more economical water treatment technology may appeal to a facility manager, insulation choices are largely based on whatever material the site has traditionally used—in spite of the cost of underperforming or failed insulation.

Water is the true enemy of thermal insulation. When insulation becomes wet, it loses its ability to conserve energy, protect workers, and maintain system performance. Thermal resistance is decimated, and the increased risk of corrosion may endanger infrastructure.

A colleague once shared the consequences of saturated insulation in an industrial steam network he had worked on in Europe. It required him to work around periodic reduced capacity and increased condensate production; overloaded steam traps; and increased consumption of fuel, water, and treatment chemicals during winter months. A near disastrous corrosion event on a heavy fuel oil tank roof and wall caused major disruption and expensive repairs. The root cause of the tank performance was corrosion under insulation (CUI), a term that was not well known at the time—he simply believed the tank had failed as the result of wet insulation.

It is critical to keep the insulation system in place and the underlying asset dry. That’s easier said than done, and some facilities have abandoned steam altogether, migrating all or part of their network to pressurized hot water systems. In many cases, this decision is motivated by frustrations born of suppressed capacity, increased maintenance costs, and compromised safety conditions whenever it rains or snows.

Case Study: Insulating Steam Systems at Duke University

Duke University is one of the countless industrial, medical, commercial, and manufacturing operations around the world that generates and delivers steam via an underground network of pipes, vaults, and tunnels. Recently, the university planned to expand its steam supply to a new state-of-the-art medical center; as the University’s Mechanical Engineer, I knew the steam network would need to operate at its highest performance levels to maintain sufficient capacity.

Duke’s steam network consists of approximately 13 miles of underground steam pipe and over 100 vaults. Unfortunately, the vaults were susceptible to severe problems whenever it rained: fugitive steam escaping the vault, boiling water within the vault, damage to the concrete vault structure, and higher operating costs, among other issues.

What caused these problems to the steam system? Wet, damaged, or missing insulation. If a vault is prone to regular flooding, certain insulation materials will not last for extended periods of time. In addition, some thermal insulation materials have a tendency to get crushed when maintenance personnel walk on the piping or work around it.

The option that Duke University chose to mitigate these concerns was a high-temperature aerogel blanket insulation. It is thin, flexible, water-resistant, and breathable. Silica aerogels are amongst the lightest solids known to science, composed of 98% air. Long chains of open celled pores create an intricate path limiting conductive and convective heat transfer. The silica aerogel structure is extremely hydrophobic and has a low thermal conductivity. These features may allow reduced insulation thicknesses to meet local efficiency requirements. Reducing the thickness of insulation in a confined space, such as a vault or tunnel, allows for easier retrofitting or upgrade of steam and condensate lines.

I had experience with this insulation before joining Duke. I had previously tested the product on a project that required the thermal insulation to work in a trench prone to flooding. Despite the challenging environmental conditions, the insulation worked and was successfully integrated into the project, leading me to believe it might also be a good choice for Duke’s steam network.

On the Durham campus, many vaults suffered severe problems whenever it rained, and the existing insulation had previously degraded and fallen off some of the pipework when it got wet. I focused on non-absorbent insulations, and recalling my earlier project, decided to test aerogel blanket insulation in a couple of high-risk vaults. While the layout varies slightly at each vault, the scope mandated upgrades to current campus standards, including installation of inverted bucket steam traps, standardized steam trap assemblies, and the testing or replacing of sump pumps. The insulation was applied to all steam and condensate piping and fittings, and valves were protected with removable jackets.

The results were very positive. Not only did the aerogel blanket survive, but it continued to insulate, contributing to the transformation of the existing network and safeguarding the performance of the medical center addition.

Duke is experiencing numerous benefits from these new insulation systems. Duke has more than 100 steam vaults with various pipe sizes and configurations. The facilities team estimated each vault’s heat loss when fully insulated versus uninsulated: on average, an uninsulated vault costs the university around $4,750/year. When fully insulated, the cost of heat loss plummets to $359/year. Duke budgeted approximately $3,000–$4,000 per vault for installing new insulation, giving the university a simple payback of less than a year. For completely bare vaults, we will see savings up to 92%. While these savings would be true for any insulation (taking into account varying thickness to match the heat loss), the main difference with using a steam-appropriate insulation—such as aerogel—is that it can withstand flooding and remain securely on the pipe, thus saving money and resources that would have been spent on re-installation.

After the first test install, I observed the system and noted there was no steaming, reduced complaints, and reduced maintenance and overtime spending—mainly due to not having to re-insulate the vault after heavy rain or a prolonged period of flooding. We now have less of a problem with sump pumps burning out prematurely due to flooding as the water does not get hot enough to damage the pump.

Insulation is vital to steam networks. Just looking at our energy/cost calculations, it is apparent that a lack of insulation cost us money and increased heat in vaults leads to brittle concrete, excessive wear on sump pumps, and unsafe conditions for entry. Additionally, excessive heat loss can quickly overload the steam traps and our condensate management system, leading to larger problems in distribution. In the past, lack of insulation on the piping had been a contributing factor to excessive condensate build up in the piping—an issue that is now mitigated.

For others in similar situations, I recommend testing the insulation materials in your worst wet environment. While I concede it may cost more to use an insulation that is new to installers (who may have been using the same insulation for decades), it will save money in the long run. I am pleased with the results of the new installation, which allows us to better manage ground-water infiltration and keep our steam system efficient and operational.

After a successful pilot, I changed Duke’s design guidelines for steam vault insulation to use aerogel blanket insulation. Each year, we evaluate the distribution system to see which vaults are least efficient and target them for re-insulation. We have re-insulated all or part of 22 steam vaults and will continue re-insulate 5–10 vaults per year until all the vaults are well insulated and operating as efficiently as possible.

In addition to using it in our steam vaults, we have started specifying this material as the primary insulation in our direct buried piping systems. The reduced insulation thickness reduces the outer diameter of the piping system and ensures the insulation will remain effective should a major leak occur. As a side benefit, the reduced outer diameter has also decreased new vault sizes and trench widths, further lowering installation costs.

Ordinarily, expanding the steam network system for the new medical center at Duke would require additional steam-generating capacity. However, the application of new insulation made the system so efficient, that we do not require this additional capacity investment.

Conclusions

Taking system conditions and likely wear and tear is a critical part of designing an insulation system. In the case of steam systems, it is vitally important to specify an insulation that can withstand the moisture and wear typically associated with these applications. Proper specification and maintenance can reduce energy usage, guard against corrosion, and garner significant financial savings.


Copyright Statement

This article was published in the May 2017 issue of Insulation Outlook magazine. Copyright © 2017 National Insulation Association. All rights reserved. The contents of this website and Insulation Outlook magazine may not be reproduced in any means, in whole or in part, without the prior written permission of the publisher and NIA. Any unauthorized duplication is strictly prohibited and would violate NIA’s copyright and may violate other copyright agreements that NIA has with authors and partners. Contact publisher@insulation.org to reprint or reproduce this content.
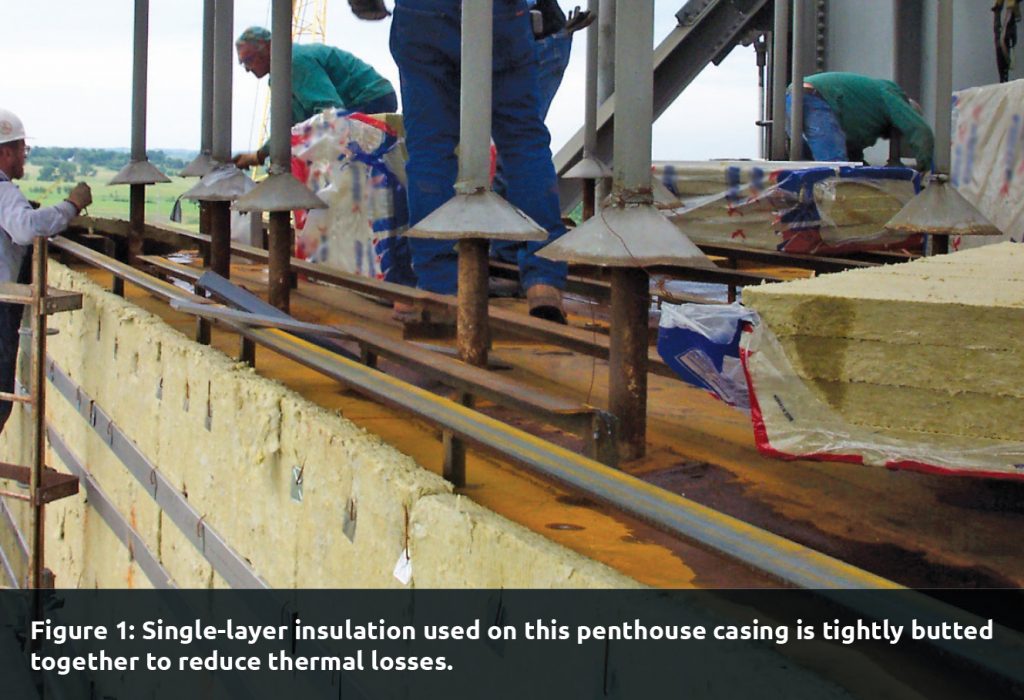
When it comes to safety, every business leader wants exactly the same thing: for all team members to go home alive and well at the end of the day. The hard part is making that happen. In order to send everyone home safe every single day, every leader has to deal with a long list of tough safety challenges. The most difficult challenge is compliance, or getting everyone to follow all the rules, all the time. It is the most important safety challenge any leader faces.

If you don’t believe that, put it to the test. Thumb though a year’s worth of injury reports, and ask yourself, “How many of those injuries would have been prevented had everyone (or even just someone) followed the rules the way they were supposed to?” Every time I’ve asked, the answer is more than half—and this includes most of their serious injuries. It makes perfect sense: in the twenty-first century, there may be plenty of hazards, but there are also plenty of rules to keep people from getting hurt by those hazards.

This all makes a valuable point about managing safety performance: the shortest route to zero injuries is through complete compliance with all rules. There are challenges, of course, to actually having 100% compliance among all employees.

Compliance: What’s the Problem?

In theory, compliance is easy. No new polices or programs are required and all the safety rules are already written down. For the most part, everyone knows the rules—making the problem of compliance seem deceptively simple.

Of course, reaching full compliance isn’t as easy as putting out a memo reminding everyone to follow the rules all the time. If the compliance problem were that simple, leaders could move on to the next problem, which I like to call, “The Next Big Thing.” There always seems to be one of these new challenges competing for the attention of the leader. This points to part of the problem—compliance doesn’t require continuous improvement as much as it does continuous management.

The Rules

The compliance problem starts with the rules. Rules are carefully crafted, reviewed, and approved by those in charge, and this aspect of safety can be carefully managed by the company’s leader. Safety culture, on the other hand, is not written down and often does not reflect the wishes of management, and is a little more tenuous to get a grasp on. Developing a safety culture in which all employees follow all rules is part of the challenge for leaders.

Another part of the problem can be where exactly to find safety rules. Site safety rules can be seen during the site’s Visitor Orientation—but these are often sandwiched between what’s found in the corporate Safety Policies and Procedures Manual and the department safety rules.

Of course, if you are taking a Visitor Orientation, it’s likely because your company is doing work for a customer at their site. Let’s assume for the sake of this example that your company and your customer’s company rules are consistent and compatible. Then, you must consider the rules that come from the outside: federal and state agency rules, industry standards, codes, and best practices. One small example: electrical work. The paperback edition of the NFPA National Electric Code runs 910 pages. While not every rule applies to every electrician doing work in any operation, many of those rules do apply to those doing electrical work.

Clearly, there are a lot of rules to keep track of, and moreover, rules are in a constant state of change. Safety leaders have an immense challenge in both deciphering the rules that apply to any given situation and ensuring they are followed.

Knowing Versus Understanding

If someone doesn’t know the rules, they can’t be expected to follow the rules. Of course, people can both know rules and not follow them—this comes down to the issue of knowing versus understanding.

Critical safety activities where failure has a much higher probability of causing serious harm (e.g., entering a confined space, achieving a zero energy state, working at elevation, or around high voltage electrical systems) demand a high level of proficiency on the part of those assigned to do the work. Knowing the rules isn’t enough; understanding them is essential.

Ensuring employees fully understand all rules requires a 2-part process. First, you must confirm what employees know about the rules and hazards. Second, you must determine how well your training process imparts the necessary understanding.

Note the use of the term “training process.” Training isn’t just what the learner sees and hears when sitting in a training class or peering into a computer terminal; it also includes the demonstration of competency once the training has been completed. Oftentimes when put to a stress test, what’s labeled as training will be found wanting.

Remembering All Those Rules

It can be difficult for any one person to know how many safety rules apply in any given situation—in many cases only a tiny fraction of rules will apply to a particular person and project.

As to what rules apply, the answer in large part depends on the work being done. Insulators, scaffold builders, electricians, and engineers might all work for the same company on the same site and follow the same general safety rules, but they are exposed to different hazards and must follow different safety rules.

As to how many safety rules each person is expected to follow, the answer is a lot more than anyone thinks. Moving chronologically, tally up all the specific rules and requirements for any given project. Start in the parking lot, move to the job site, and then consider the assigned task of the day—the number of safety rules and requirements that apply to every individual easily runs into the hundreds. How many of those rules do you think anyone remembers?

Here’s where real-life operations work to the advantage of all; in practice, there is a relatively small number of safety rules that each employee uses on a regular basis. While that number is higher than most people think, it’s still a manageable number—and repetition and enforcement make it more memorable.

Repetition affords a huge benefit: it creates habit, making it easier to do something without needing to give it much thought. With repetition, remembering (and learning) becomes easy. Repetition, although it is a simple technique, is one of the most powerful weapons in a leader’s strategic arsenal to win the war on compliance. The bad news, of course, is that if what is learned isn’t put into practice, it will be quickly forgotten—this makes it absolutely critical to ensure that employees are following safety rules consistently at each project.

Situation Recognition

The rules for elevated work don’t apply when standing at ground level, a confined space permit isn’t required to enter the conference room in the front office, and the procedure to assure a zero energy state doesn’t apply when opening a door on a company pickup truck.

Those situations are so obvious, they seem silly. But, they demonstrate an important principle that governs the safety rules: most apply on an “if or when” basis. If something is going to be done, or when certain conditions exist, the procedure must be followed. The rest of the time, it need not.

In practical terms, that creates an additional variable in the compliance process: recognizing that situation or condition. Barriers can be put up (fences and tape) and signs can be posted (Vehicle Entry Permit Required or Authorized Personnel Only) making the situation obvious to the point where it becomes difficult to not recognize and comply with the rules. Other times, those doing the work are left to recognize and evaluate those conditions and situations as they arise. Processes such as pre-job planning and work permitting provide the check and balance of a second set of eyes—ideally an expert set of eyes.

Still, there’s an important role to be played by those who actually are in harm’s way. For example, a simple task can grow to include a more serious hazard (e.g., when working above ground level, but not too far off the ground). This is where the importance of judgement and safety training comes in.

Finally: The Matter of Choice

Even if someone knows and understands the rules, remembers the rules, and recognizes that the rules apply in their situation, there is no guarantee they will follow these rules. Those conditions are necessary—but not sufficient—to cause compliance. There’s still the matter of individual choice: choosing to follow the rules exactly the way they were written. Getting people to choose to make the right choice at the point of execution may be the toughest part of the problem with compliance.

One of the issues with compliance is that rules can often impede job operations by slowing things down, making a job more difficult, or even the basic issue of discomfort with personal protective equipment (PPE). The challenge of the safety leader is to impart the importance of following the rules, even when they seem like an imposition.

The Challenge of Compliance

Leaders face certain hurdles in ensuring compliance: making sure employees know all the rules, understand all the rules, and recognize and follow the rules as necessary. Managing compliance on the job site has to be a priority for any business leader. By offering proper training, imparting both the knowledge of and importance of following the rules, and ensuring employees practice these rules over and over, leaders can help ensure ongoing compliance management and safety.


Copyright Statement

This article was published in the May 2017 issue of Insulation Outlook magazine. Copyright © 2017 National Insulation Association. All rights reserved. The contents of this website and Insulation Outlook magazine may not be reproduced in any means, in whole or in part, without the prior written permission of the publisher and NIA. Any unauthorized duplication is strictly prohibited and would violate NIA’s copyright and may violate other copyright agreements that NIA has with authors and partners. Contact publisher@insulation.org to reprint or reproduce this content.
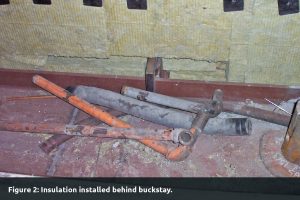
OSHA to Delay Enforcing Crystalline Silica Standard in the Construction Industry

The U.S. Department of Labor’s Occupational Safety and Health Administration (OSHA) recently announced a delay in enforcement of the crystalline silica standard that applies to the construction industry to conduct additional outreach and provide educational materials and guidance for employers. The agency has determined that additional guidance is necessary due to the unique nature of the requirements in the construction standard. Originally scheduled to begin June 23, 2017, enforcement will now begin September 23, 2017.

OSHA expects employers in the construction industry to continue to take steps either to come into compliance with the new permissible exposure limit, or to implement specific dust controls for certain operations as provided in Table 1 of the standard. Construction employers should also continue to prepare to implement the standard’s other requirements, including exposure assessment, medical surveillance, and employee training.

President Signs Resolution Blocking Recordkeeping Rule

On April 4, 2017, the President signed a resolution that will halt implementation of OSHA’s “Volks” final rule—also known as the Clarification of an Employer’s Continuing Obligation to Make and Maintain an Accurate Record of Each Recordable Injury and Illness through the Congressional Review Act (CRA). Many contractor industry groups celebrated this change, citing the rule as overly burdensome.

The rule had extended the time period in which an employer could be cited by OSHA for recordkeeping violations from 6 months to up to 5 years. With the President’s signature and the enacting of this resolution, this rule is eliminated.

U.S. Labor Department Proposes Delay to Beryllium Rule Effective Date

The U.S. Department of Labor recently announced a proposed delay in the effective date of the rule entitled Occupational Exposure to Beryllium, from March 21, 2017, to May 20, 2017. The announcement follows a White House memorandum entitled “Regulatory Freeze Pending Review,” issued January 20, 2017, that directed the department to undertake a review of any new or pending regulations and temporarily postpone the date that they would take effect.

The proposed delay will allow OSHA an opportunity for further review and consideration of the rule, in keeping with the White House memorandum. OSHA published the final rule on January 9, 2017, and, in response to the memorandum, previously announced the effective date would be postponed to March 21, 2017. In its review process, OSHA has preliminarily determined that it is appropriate to further delay the effective date to May 20, 2017, for the purpose of additional review into questions of law and policy.

The proposed extension of the effective date will not affect the compliance dates of the beryllium rule.

For the latest updates on these and other regulations, please visit www.osha.gov.


Copyright Statement

This article was published in the May 2017 issue of Insulation Outlook magazine. Copyright © 2017 National Insulation Association. All rights reserved. The contents of this website and Insulation Outlook magazine may not be reproduced in any means, in whole or in part, without the prior written permission of the publisher and NIA. Any unauthorized duplication is strictly prohibited and would violate NIA’s copyright and may violate other copyright agreements that NIA has with authors and partners. Contact publisher@insulation.org to reprint or reproduce this content.