Category Archives: Global

There are a number of reasons why facility managers might want to consider an insulation energy appraisal at their location. One is the potential for hundreds of thousands of Btu savings. Another is the opportunity to improve process control and efficiency. A third reason is contributing to a cleaner environment through the reduction of emissions into the atmosphere.

And last, but certainly not least, let’s not forget the factor that gets everyone’s attention: money. Or more specifically, saving money through reduced fuel costs.

Such opportunities were among the reasons why the National Insulation Association’s Growing the Insulation Industry Committee created the Insulation Energy Appraisal Program (IEAP). The IEAP is a major industry initiative designed to give facility/energy managers a better understanding of the true dollar and performance value of an insulated system. The program is a tool that quantifies the amount of energy and actual dollars a facility is losing with its current in-place insulation system, and-as mentioned previously-demonstrates the real world benefits of a more efficient system.

The IEAP, which debuted in October 2000, is a professional, accredited program taught by industry educators, with examination and certification through a national certification agency. Students can receive 1.5 continuing education units for participating in this program. Through IEAP, NIA has been selected by the U.S. Department of Energy’s Best Practices Allied Partnership program.

Since the program’s start, more than 200 industry professionals have earned the title of "Certified Insulation Energy Appraiser." The IEAP’s two-day course has been taught in eight cities across the country, with several more scheduled for 2002. In the program students learn how to:

  • determine the optimal insulation thickness and corresponding energy and dollar savings

  • interview customers to gather information for the appraisal

  • conduct a facility walk-through

  • use the 3E Plus® computer software program

  • determine the amount of greenhouse gases saved through the use of insulation

  • analyze and complete the appraisal spread sheet

  • complete a final customer report

  • market their new skills to potential customers
Justifying Insulation Through Appraisals

Has the IEAP made a difference for those individuals that have received the certification? A survey conducted by NIA in the fall of 2000, one year after the program started, sought to answer some of those questions. So far, the response has been fairly positive.

"An insulation appraisal survey represents one of the best methods to justify new insulation," said James Christian, project engineer with Gregg Industrial Insulators Inc., in Longview, Texas.

Christian mentioned a project that involved a steam feeder system for several turbines at a chemical processing plant. Based on implementing his recommendations after conducting an appraisal, Christian said the plant was able to achieve a 72 percent reduction in energy losses, amounting to a savings of 46 million Btu’s per year per lineal foot of pipe. Several hundred feet of pipe, 10 inches and 12 inches in diameter, were insulated.

Christian also pointed out that the plant was having a greater than expected temperature loss from the input of steam to the turbines (it was trying to maintain a base temperature of 750 degrees fahrenheit). Christian and his colleagues found poorly insulated areas that were losing steam. Once these areas were properly insulated, the plant saw several benefits. The base temperature was maintained, and as a result the turbines were able to run more efficiently and with less energy because they weren’t having to overcompensate for the loss of steam and temperature.

Christian, a member of the IEAP charter class, says that he sees potential opportunities to use his credentials to secure appraisal jobs, but admits getting in the door can be tricky.

Explaining the attitude of facility and plant managers, he says, "Realistically, the problem (lack of and/or improper insulation) is slow to catch on. Unless something gets completely broke, it doesn’t get fixed. Insulation isn’t always at the top of the list." Christian said that tight maintenance budgets and the perception that other needs are more important often push insulation down in the pecking order of priorities. He thinks the key in selling managers on appraisals is to explain concisely the bottom line benefits and demonstrating your credentials and tools at your disposal.

"The fact that I became certified has given me more weight to what I do with the company," said Christian. "It’s made me more of an informed person overall, and given me more of a connection with the industry."

With more than 20 years experience in the industry, Ray Hoornstra certainly knows insulation. Obviously he could speak about the positive aspects of proper insulation and its value as a money saver. However, since completing the IEAP class conducted in Houston in February 2001, Hoornstra has been able to complement his prior experience with an added layer of expertise as a certified appraiser.

"Before I took the class, I never had anything I could use to calculate and point out dollar savings," said Hoornstra, who is project manager/project estimator with Service Environmental Co. in Beaumont, Texas. "People tend to respond when you put actual dollars and cents in front of them, especially if you can work out a payback period. The 3E Plus® program is a good tool, and the spreadsheets work well.

Of the class itself, Hoornstra said, "I was pleased. The instructors were good and it was very educational."

When trying to secure appraisals for large industrial facilities, Hoornstra said it’s important to keep the scope of the work in perspective.

"If you commit to the whole plant, it’s going to take at least a year to complete because of the size," he said. "I told my customer, ‘Let’s look at this one piece [section] at a time.’ After that we can move on to the next area. This allows me to get them feedback in a timely manner. They liked the information in the final report, and I was able to give them about a six month payback."

Working in Tandem

Steve Campbell said that his company, Owens Corning, started a thermo analysis program in 1999. Campbell, a specification manager and certified thermographer for the company based in Big Sandy, Tenn., became IEAP certified in Houston in February 2001. He said the IEAP has been a good complement to his work with the previously established Owens Corning program.

"It fits like a glove," he said, adding that many people know about NIA and the IEAP. "In a lot of facilities, people get the Insulation Outlook and are familiar with NIA. It helps open the door."

Campbell said that based on the size of a project, the savings for customers can vary. He’s done jobs where savings ranged from $18,000 annually per year for a smaller project to as much as $750,000 for larger efforts.

To illustrate the savings potential of proper insulation, Campbell said a foot-long piece of uninsulated pipe might cost a facility $100 annually. He points out that by providing the proper insulation using calculations from the 3E Plus® program, that same piece of pipe might cost only $20 per lineal foot. Multiply that $80 savings by 100 lineal feet of pipe, and you have $8,000 in savings. You get the picture.

"It all adds up," said Campbell. "And the 3E Plus® program is a quick and easy way to do the calculations."

As with other appraisers, Campbell said when trying to solicit an appraisal, it’s important to make your case clearly and concisely.

"They just don’t happen overnight," he said of new appraisals. "You have to nurture it along. If we can get in and do an energy appraisal and tell them how much money they are losing, that puts a different light on it." Speaking of light, Campbell said his work with infrared technology is often a quick way to get the attention of a facility manager.

"It’s like the old saying, ‘A picture is worth a thousand words,’" said Campbell. "If you can get in the plant, do a walk through, and show them they can get their investment back in four months, it makes a difference."

Joe Tucker, vice president and general manager for Dynamic Services, Inc. in Evanston, Wyo., was certified in the Atlanta class in the summer of 2001. Of the IEAP, he says, "It’s really been useful. It gives a whole new outlook to the 3E Plus® program. I like the spreadsheet that comes with [the software]. I think the information gives a good perspective for the clients. For me, it’s definitely beneficial. It’s always good to keep learning and stay on top of the industry."

Observations

Even with the success of the IEAP, some who have been certified offer suggestions to make the program even better.

The North American Insulation Manufacturers Association, the developers of the 3E Plus® software program, is working on a new version of the software and plans to include several of the suggestions made by a number of certified appraisers. This new version is expected in about a year.

When Brian Campbell, an outside sales representative for Insul-Therm International in Commerce Calif., took the class in March 2001, skyrocketing energy prices were creating a crisis in California. However, since then, energy prices have plummeted. Now, Campbell said, the incentive to save energy has faded a bit.

"People in California aren’t up in arms about the issue," he said.

Also, Campbell said that in his opinion the program isn’t as geared toward the cold market, which is where he specializes.

Still, he adds, "I really think it’s a good program, especially for contractors, as they’re on the front line. I think it’s a good value added element for a company. I’m glad I took the class. I just think it needs to be fine-tuned a bit, and I’m looking forward to the refinements and improvements."

Steve Campbell said that September 11 has been a factor. The attacks accelerated the economic downturn, with production also taking a hit as well. Also, the increased security at industrial facilities due to Sept. 11 has also hampered access.

Future Plans

As part of its efforts to create awareness of insulation’s benefits, the IEAP is looking forward to expanding the pool of certified appraisers. Additional classes are being scheduled nationwide for 2002. When locations have been secured, class information will be posted on the NIA Web site at www.insulation.org in the "Training & Certification" section. If you are interested in learning more about the program or if you know of somebody else who could benefit from certification, please visit the NIA Web site or call (703) 683-6422 for more information.

Opportunities to use handheld, noncontact, infrared (IR) thermometry in the installation and maintenance of a thermal insulation system are everywhere, and industrial plant and energy management professionals are picking up on it.

Driving recognition of the value of this technology in a wide range of industrial settings is a growing awareness that temperature measurement can be a critical indicator of existing or impending problems with plant equipment and processes. It’s also a method of visually demonstrating energy savings and losses in large and small facilities. These are facts that have been well known in automotive circles for years, and a boon to equipment maintenance and heating and air-conditioning technicians as well. Accurately, instantly and safely measuring temperatures in hard-to-reach, too-hot-to-touch, or dangerous locations is what portable infrared thermometry does best.

Affordability, Ease of Use Help Drive Demand

Ease of use, flexibility, accuracy and safety has inspired many to use infrared technology as a diagnostic, maintenance, equipment failure and downtime prevention tool. But that acceptance is a fairly recent shift, primarily because the cost of what was an expensive option has dropped dramatically, with models in all budget categories and for nearly every use now available.

Prices typically range from as low as $99 for basic models with few options, to as high as approximately $2,500 for specialty-built, high performance models that can measure temperatures as low as minus 20 degrees fahrenheit and as high as 5400 degrees fahrenheit. Middle range IR thermometers with options such as data logging and circular laser sighting systems cost between $250 and $450, while those with superior optics and graphing software are approximately $1,000.

How Infrared Thermometers Work

Even though infrared thermometry technology is sophisticated, it’s simple to use. Handheld units are typically gun-shaped, and the user simply points the thermometer at the object to be measured, pulls the trigger and read the temperature in the liquid crystal display (LCD) window.

As easy as it is to use, it’s still important to understand how IR technology works and what it can and can’t do. IR thermometers capture the invisible infrared energy that’s naturally emitted from the surface of all objects. As a result, IR thermometers measure surface temperatures only. When IR thermometers measure surface temperatures, they sense reflected, transmitted, and emitted energy. Therefore, all thermometers have to be adjusted so they will read emitted energy only. Some IR thermometers allow users to adjust the emissivity in the unit for more accurate readings on all material types. Others have a fixed, pre-set emissivity of 0.95, which is the emissivity value for most organic materials and painted or oxidized surfaces.

In addition, IR thermometers can’t measure accurately through glass, as it has very distinctive reflection and transmission properties. Moreover, they aren’t usually recommended for measuring shiny or polished metal surfaces such as stainless steel or aluminum. However, covering the surface to be measured with masking tape or flat black paint can produce accurate measurements, as long as the tape or paint is allowed to reach the same temperature as the material underneath.

IR radiation is part of the electromagnetic spectrum, which includes radio waves, microwaves, visible light, ultraviolet, gamma and X-rays. It falls between the visible light of the spectrum and radio waves, and is usually expressed in microns with the infrared spectrum extending from 0.7 to 1000 microns. In practice, the 0.7 to 14 micron band is generally used for IR temperature measurement.

Choosing the Right Unit

A wide range of models give users many choices. Units with few options to high performance products that can download logged data for use in computer programs, such as 3E Plus®, a free software program from the U.S. Department of Energy’s Office of Information Technology, are available. The 3E Plus software provides quick, painless energy and dollar savings calculations. In choosing the appropriate model, the user should select a thermometer based on the answers to three key questions:

  • What temperature range will I need to measure?

  • How far away from my target do I want to be when I take my measurements?

  • How precise must the temperature measurement be?

Identifying the temperature range needed on an IR thermometer is straightforward, as each model is designed for a specific temperature range, including subzero models, some of which can measure temperatures as low as minus 50 degrees fahrenheit.

But relating the distance to the target to be measured to a particular thermometer model is a more complex situation, and relies on the instrument’s optical ability. When temperature is measured by a non-contact device, the IR energy emitted from the object passes through the optical system and is converted to an electrical signal at the detector, and is then displayed as a temperature reading.

Most manufacturers calculate the optical resolution as a ratio of the target diameter ("spot") containing 90 percent of target energy to the distance. The user’s manual provided with each unit shows the distance to spot (D:S) ratio at a range of distances. Using this information, the user can choose an IR thermometer that has a D:S ratio that meets the distance and target size requirements for the project. The higher the D:S ratio is, the more expensive the model is likely to be.

When precise temperature measurement is required, the user must consider what information is needed. If tracking temperature trends over time is desired, a professional model thermometer with greater than 1 percent accuracy is recommended. However, if only large temperature differentials are needed, an entry-level unit with a 2 percent to 3 percent level of accuracy may suffice.

Infrared Sighting Systems

IR thermometers designed for industrial use can have single point or circular laser sighting systems that provide various aiming advantages. Laser sighting doesn’t measure temperature, it merely helps to effectively aim the thermometer. It’s the IR detector inside the thermometer that senses the IR energy being emitted from the target being measured.

A single point sighting system aims the thermometer at the center of the target for accurate aim, but it doesn’t show the boundaries of the measured area, or the size of the target. The user must calculate or look up the target size in the user’s manual.

Offset sighting finds the energy spot’s center from a slight angle because the laser is actually mounted above the IR detector. This "parallax" effect can cause a mismatch between the IR circle’s center and the laser sighting’s center, and is more pronounced in the near field. As a result, some IR thermometers may miss large parts of the target energy.

Similarly, circular sighting systems with offset mounting contain a large portion of the target energy within the circle while helping aim the unit using the center dot. Like the single point with offset sighting, a parallax occurs, especially in the near field, which doesn’t track with the IR beam. Accuracy can be affected because the relationship of the IR beam to the sighting isn’t constant at all distances.

The most precisely sighted portable IR thermometers (and as a result, the most costly), are those that feature circular laser sighting systems with coaxial mounting, which places the laser and IR beams on nearly the same pathway. These models highlight approximately 90 percent of the measured target at all distances, and are especially useful in the near field and for close-focus. Because of their optical precision, these high performance models allow the user to pick the temperature through a maze of hot, dangerous pipes without having to move a ladder.

It also helps to understand that laser and IR beams travel in different ways. Laser beams travel in a straight line from their source with the pattern spreading in a cone shape from the thermometer. By comparison, IR beams take a "bowtie" route of travel that narrows until the focal point and then expands.

Once an IR thermometer has been purchased, most models can be put to effective use within 10 minutes, including reading the owner’s manual. Higher performance models with data logging and graphing and trending software have a somewhat longer learning curve, but can be quickly mastered with the help of tutorials.

There are three basic techniques that can be used to take IR readings.

  • Spot measuring: determines the absolute surface temperature of an object
  • Temperature differentials: compares two separate spot measurements, either in different locations or at the same location over time

  • Scanning: identifies hot or cold spots when you hold the trigger while moving the thermometer along the target

Since temperature is a key indicator in thermal insulation systems, all three of these techniques can be used for a variety of installation or troubleshooting activities. For instance, by scanning along the insulated piping, the user can instantly, safely and accurately detect costly problems such as hairline cracks in an insulation system. Evaluations to determine where energy is being lost in certain locations can be documented by spot measuring. Temperature differentials are a "natural" means of determining the before and after affects of added insulation.

Saving Time and Money

The greatest value of using IR technology in the insulation installation industry may lie in its ability to visually document heating and cooling losses to potential customers, by spot measuring and recording and tracking temperature differentials. In addition, infrared technology is a time saver. When used with software programs such as 3E Plus, it can precisely evaluate thermal insulation options.

As an example, an energy management engineer at Goodyear Tire in Akron, Ohio, used an IR thermometer on a project to evaluate the need for insulation on a bare steam condensate return line. Measuring the temperature of the pipe at various spots gave him a "real world" way to check "book" heat loss calculations.

"It turned out in this case that the insulation project did not meet our funding criteria, but at least the thermometer helped us make an informed decision," he said.

He found that it also gave him a very quick way to tell which hot lines were in actual use. On steam systems, for example, he used his IR thermometer to roughly categorize steam traps by temperature so he could tell where he should concentrate his insulation efforts.

But his biggest pay-off using his IR thermometer came after he used it to figure out the route of water flowing through a maze of pipes in a seven-story, 500,000 square foot building.

He approached the job in winter when the pipes would be significantly colder than the ambient temperature. Pipes with actively flowing water measured 40 degrees fahrenheit. With that information as his guide, he followed pipes that lead in all directions and sometimes to dead ends.

"I found some places where water was flowing in large quantities down the sewer because a hose had been connected where it shouldn’t have been," he said.

In another instance, he found a water-cooled heat exchanger that hadn’t been used in years but still had water flowing through it. In less than a week of part time work, he had traced the pipes and drawn a map of the entire water system, and saved $100,000 in the process.

Similarly, a chief engineer at a 33-story co-op complex in New York, connected to three additional buildings that include a movie theatre, restaurant, bank, drug store, beauty parlor and country club with two pools, exercise rooms and an 18-hole golf course, found IR thermometry a very useful and time saving tool.

"Working around a power plant you sometimes cannot get close enough to your target for other instruments to zero in on a reading (3 feet to 6 feet)," he said. "I can be within 20 to 30 feet and use the target dots (circular laser) to tell where I am reading"

Benefits for Insulation Professionals

Clearly, for thermal insulation professionals, IR thermometers can be just as powerful in documenting heat or cooling losses before, and energy savings after installation of thermal systems, adding credibility to a contractor’s recommendation. Moreover, it can be done very quickly and safely without having to climb on ladders. Scanning already installed systems, even in very large facilities with hard to reach pipes to find cracks and breaks, or locations that are under insulated that may be responsible for energy losses, can be accomplished in a relatively short time with the appropriate IR thermometer.

Likewise, using a portable IR thermometer to measure the surface temperatures of pipes and then feeding that information into a program like 3E Plus can help make appropriate, high return on investment choices about the type of insulation and thickness needed for each job, and confirm a temperature baseline.

Temperature is the tie that binds thermal insulation systems and IR thermometry together. Where there are temperature issues, it’s important to have safe, accurate and easy ways to evaluate those challenges. Once those issues are identified and documented, thermal insulation systems can be specified and installed. After those systems are installed, IR thermometry can help keep them properly monitored and maintained.

As in the case of the Goodyear Tire engineer, the return on the investment in an IR thermometer can be as short as a week or a day. In a temperature driven environment such as thermal insulation specification installation, the opportunities for its use are limited only by the user’s imagination.

Figure 1
Figure 2

Construction industry analysts and economic forecasters at a recent conference provided both bad and good news about the outlook for the next few years. While some said much of 2002 will see declines in construction activity and the economy in general, most also predicted quick recovery by 2003.

Among the forecasters at CMD’s 6th annual North American Construction Forecast in Washington, D.C., was Bill Toal, chief economist for the Portland Cement Association in Skokie, Ill. According to Toal, the U.S. construction industry can expect an overall decline of 6.3 percent in activity next year due to the economic downturn. Still, "by historical contrast this would put construction spending back to slightly above 1998 levels, which were record levels of activity," he said.

"We expect a 10 percent decline in private, nonresidential construction spending next year after a 5.4 percent drop this year," Toal said.

Toal said it won’t take long for the construction industry to recover. He predicts the construction industry overall will see a 4.2 percent increase by 2003. Toal attributed the decline in construction activity in part to a "hole in the economy. The economy was already weakening significantly before the events of September 11." Forecasts have been revised down further because of those events. He revised his overall economic growth rate predictions for 2002 to 1.8 percent, down from his prior forecast of 2.7 percent. In contrast to the declines in residential and nonresidential construction, public construction was predicted to grow slightly, albeit at a much slower rate than it has for the past two years.

Retail/Industrial/Commercial Outlook

Glenn Mueller, a professor with the John Hopkins University Real Estate Institute and managing director for Real Estate Investment Strategy with Legg Mason, Inc., said there are two ways to look at how construction is faring: the physical realities of demand and supply and the financial realities of where capital is flowing and how it affects pricing.

For example, Mueller said the demand and supply cycle in the office sector has reached some equilibrium after several decades of dramatic swings in what was available and who wanted it, he said. Those levels will remain somewhat balanced though both sides will be lower for the next year or so, he said.

The demand and supply cycle is local in nature, Mueller said, and different cities in the United States are at different points in their cycles. For example, in the office market cycle analyses, Washington, D.C., San Diego, Los Angeles, and parts of New York, as well as a host of other metropolitan areas, are in the hyper supply stage of their cycle-they are experiencing increasing vacancies, but new construction is still occurring. Dallas, Jacksonville, Tampa and Salt Lake City, however, have bottomed out-they have low or negative demand growth and construction starts have greatly slowed, but completions are still occurring. They have actually entered a recession stage in their office market cycle, according to Mueller.

In the industrial market, none of the nation’s major cities had yet entered the recession stage at the end of the second quarter. But in the hotel market, most are moving toward that stage and some markets like Charlotte, Cleveland, Indianapolis, Philadelphia, Phoenix and Portland, have already entered it.

On the supply side, construction labor had been the hardest to find in 2000, Mueller said, but that situation is easing rapidly this year. Meanwhile, materials costs are increasing and the nation’s infrastructures have not been expanded, which restricts new approvals and thus new construction.

Mueller had said demand growth will be stable but slower, and once supply growth slows to match it, equilibrium will return. For most of the construction industry, Mueller said a growth phase should begin in either late 2002 or early 2003.

Mixed Signals North of the Border

While the Canadian overall economy is following the United States in a downturn made worse by the events of September 11, there are some bright spots ahead, according to Alex Carrick, chief economist for CanaData. One of those bright spots is the institutional building market, where several segments of have hit seven-year building level highs.

The segments include hospitals, which climbed this year to more than $4.4 billion in commitments to new projects for 2001; schools, which had more than $2.3 billion allocated for education-related projects in 2001; and senior homes, which hit a high of $1.35 million and hold promise for further growth.

Unfortunately, Carrick said other sectors of the construction industry don’t look as bright. The biggest drop in construction starts in Canada occurred in the industrial market, which fell almost 50 percent this year from 23.5 million square feet in 2000 to 12 million square feet in 2001. A large part of the decrease was due to events in the automobile industry, where a 10-year boom just ended and an anticipated three- or four-year decline began.

Other aspects of construction in Canada are tracking closely to what is occurring in the United States, and some of these areas will most likely feel the effects of decreased consumer and business confidence that was exacerbated by the terrorist attacks.

Commercial construction starts for 2001 are expected to be 45.5 million square feet, slightly less than the 47.9 million of 2000. Carrick predicts starts will continue falling to 42.5 million square feet in 2002, but rebound to 44.5 million by 2003. The probable effects on commercial construction of the terrorist attacks include more office building in the suburbs rather than downtown skyscrapers; lowered retail construction activity because of consumer anxiety; and negative impacts on the hotel industry. Conversely, the entertainment industry, including casinos and entertainment complexes, may flourish as people seek escape from their worries.

Engineering investment, including infrastructure projects as well as energy projects, continued an upward trend from $41.4 million spent in 2000 to $46.7 in 2001 and is expected to be over $49 million in 2002. "The question here is whether funds diverted into military spending will be taken away from infrastructure projects," Carrick said.

Founded in 1975, CMD is a leading worldwide provider of quality construction information products and services designed to advance the businesses of its customers with timely, accurate and actionable project, product, and cost data. For more information, visit www.cmfg.com or call 1-800-793-0304. CMD is a division of Cahners Business Information, a member of the Reed Elsevier plc group.

You may be wondering what water gauge, stiffeners and insulation have in common? Well the answer is a lot. The design and installation of a lagging and insulation system on a selective catalytic reduction (SCR) system for reducing nitrogen oxide emissions will depend heavily upon the stiffener arrangement. The stiffener arrangement will depend on many factors, including the water gauge that the casing of the SCR, or flue plate design is to be based upon. Unfortunately, that explanation tells you very little of what you want to know.

The environment is an important issue in our lives today. The Ozone Transport Assessment Group (OTAG) identified power plants as the most significant source of nitrogen oxides (NOx) emissions in the country. Based on OTAG’s recommendations, the United States Environmental Protection Agency (EPA) proposed that nearly two-dozen states and Washington, D.C. reduce their emissions of air pollution by the year 2003 (This has since changed, with the date moved back). One way to reduce NOx emissions is by installing SCR systems. An SCR system is basically a large box placed in the gas flow of exit gas flue that sprays ammonia into the gas and thereby reduces the nitrogen oxides in the flue gas that exits the stack. An SCR system will only work correctly if the flue gas temperature remains at or above its operating design temperature requirements.

These SCR systems must be insulated and lagged correctly to prevent excessive heat loss and for personnel protection. If you read "Lagging 101" in the April 2001 issue of Insulation Outlook, then you would know that the first thing you do when designing a lagging and insulation system is to review the area to be insulated and look at the stiffener size and pattern.

If the stiffener pattern and size is so important that it’s the first thing you look at when designing a lagging and insulation system, it would behoove us to understand how the size, shape and pattern of the external stiffeners is developed.

Casing Design

There’s a lot of work involved in an SCR system, including the design of the casing for the SCR box that the gas will pass through. This casing design will vary from plant to plant depending upon where the SCR system can be placed. Most often these systems will be needed at existing power plants, so space will be at a premium. Along with the physical location and restrictions, there will be other factors that will effect the design such as the gas temperature, nitrogen oxide levels, and the water gauge to which the casing is to be designed. Each of these factors (physical restrictions, gas temperature, and water gauge) will effect the insulation and lagging design. Of all the factors, in my opinion, water gauge is the most important and least understood.

The term "water gauge" refers to an instrument that indicates the level of water, as in a boiler, tank, reservoir or stream. The measure of the amount of water shown on the water gauge instrument is measured in "inches." That in itself still doesn’t tell us very much but it’s as good a place to start as any.

Stiffener Sizing

Stiffener size is based primarily on three essential items, span, pressure, and temperature and is limited by stress or deflection. So the question arises as to how or where to begin for sizing stiffeners?

After a layout has been completed for a flue or duct system, the individual components must be designed from a structural standpoint to withstand forces due to the following:

1. internal static pressure of the contained fluid (in this case spent gas or air)

2. transient pressure designated for the system (where we find reference to water gauge)

3. dead weight of plate, stiffeners, insulation, lagging, etc.

4. wind and seismic loading

5. expansion joint actuation forces

6. coal ash accumulation (if applicable)

7. load transfer from other equipment

All of the previously mentioned factors must be taken into account for the design of the SCR casing. You will notice the absence of any reference to insulation thickness requirements. However, to simplify what we’re trying to discern (how water gauge affects stiffener design), lets look at one particular way (there are many ways to do this) for calculating stiffener sizing.

Side stiffener calibration example for a horizontal flue:

Specific Design Information

  • Duct 8 feet high x 16 feet wide x 3/16" plate
  • 24" stiffener spacing
  • Temperature of 800 degrees fahrenheit
  • Pressure at steady state+25" H20
  • Pressure at transient state
  • Flue wall weight
  • F9 = 12000 PSI
  • S MT=19200 PSI
  • Span = 8 feet =96"

Using the side stiffener calibration information, we will be able to determine the size of the stiffener by using the following formula:

You then would go to a book like the AISC Manual of the American Institute of Steel Construction to find a stiffener size that’s close to the above calculation. In this case it would be a 3 inch x 3 inch x ¼ inch angle that has a Z equal to 2.5 cubic inches.

Transient Bending (Positive Pressure)

Now we will take our chosen angle size and recalculate to see if our chosen angle will work by checking to see if is less than value.

We now compare this value to the value of 19200 PSI and we see that our choice is acceptable because it’s less than 19000 PSI. As you can see, to calculate stiffener sizing is quite complicated. There’s still another step before you can officially say that the 3 inch stiffener is okay. You must calculate the transient bending or negative pressure, but I think you’re getting the picture now.

There are two key elements in the previously mentioned formulas that have a direct affect upon insulation and lagging systems. They are both found in the formula for "M," stiffener spacing and water gauge pressure.

Now I must apologize to all those who do this for a living. It’s not my intent to oversimplify but only to develop a point to show how a stiffener size calculation works. Today, all such calibrations are being done on a computer, and that’s exactly my point. Years ago those people doing the calibrations considered the insulation and lagging systems when determining their stiffener sizing and spacing. That’s not the case today. It wasn’t more than 15 years ago that the norm for the water gauge pressure for a flue, duct, or casing system was around 17 inches. Today it’s 35 inches or more. That’s why today it’s common to have very large stiffeners (12 inches or greater) on very wide spacing (greater than 48 inches).

I also must point out that it wasn’t a coincidence that the early stiffener spacing matched the average width of a mineral wool board of 24 inches, 36 inches or 48 inches wide. The early designers of flue and duct considered the insulation application because their water gauge pressure was half what’s required today. The higher the water gauge, the bigger the stiffeners.

Insulation System of Yesterday’s Water Gauge

The stiffener sizing of yesterday was based on a much lower water gauge pressure (around 17 inches) and were spaced normally at 24 inch, 36 inch or 48 inch spacing. This spacing allowed the insulation to be placed between the stiffeners without having to cut to fit. Some companies actually made standards about stiffeners and insulation. Some examples:

1. When the external stiffeners are spaced 6 feet or more apart, the insulation should be humped over these stiffeners.

2. When the specified insulation thickness is within 2 inches of equaling the total stiffener height, than the insulation thickness is to be increased to bury the stiffener with at least ½ inch thick or more.

3. External stiffeners should all be of the same height on any one rectangular surface as required to meet stiffener span designs.

Taking the same flue as described earlier, the minimum insulation thickness based on 800 degrees fahrenheit and having to meet a surface temperature of 130 degrees fahrenheit, with an ambient air of 80 degrees fahrenheit and an external wind velocity of 50 fpm with aluminum lagging would require 4 inch thick of a mineral wool 8 pound density board insulation. Per the design specifics the thickness of insulation should be enough to bury all stiffeners. This one layer of 4 inch thick insulation would be notched to allow for the stiffener flange and then placed between the 3 inch stiffeners. After the insulation has been applied, than an outer lagging would be installed over the now flat insulated surface.

Insulation Systems Based on Today’s Water Gauge

The insulation systems of today would never be able to meet the previously listed design specifics of humping or burying of the stiffeners. The stiffeners, being designed today on hot flue, duct, or SCR casing (700 degrees and greater), are quite large and much farther apart. It’s very common to find 6 inch, 8 inch, 12 inch or even greater stiffeners. This is due in part to the water gauge number being used in their design calculations and in part because they haven’t considered the required insulation thickness and its application.

I’m not sure why the water gauge number was increased, but I’m sure that there was a very good reason for it. Be that as it may, the point is that we must work within the design parameters to find an appropriate and economical system to insulate and lag these SCR systems.

The square foot area of additional flue work, including an SCR system, is staggering (100,000 square feet per SCR system is common). The stiffeners being designed on these SCR systems, and on the associated flues, are very large. It would be impossible to hump them or to bury them. Let’s take a look at some of insulating and lagging options.

Insulation and Lagging Systems for a hot SCR System

The design parameters for the insulation and lagging systems will be the same as before. The insulation type will be a mineral fiberboard. The outside surface temperature will be 130 degrees fahrenheit, with an ambient air of 80 degrees fahrenheit and an external wind velocity of 50 fpm. The fasteners shall be spaced to withstand a 30 pound per square foot suction or pressure wind loading and all systems are to be considered outdoors.

H Bar System

This system uses a pre-fabricated support system, much like the manufacturers of continuous gutters (that is, installed over the outside of the stiffeners). These H-looking steel channels are attached to the external surface of the stiffeners and form a picture frame, in which the insulation sits. The lagging will then be attached directly to the H-bar frame. Unfortunately, this system isn’t recommended for hot flues of more than 450 degrees fahrenheit because of the potential heat transfer between the stiffener and the H bar system. Adding an insulation system directly to the flue plate prior to installing the H-bar system may minimize the potential heat loss and would then make this a viable and realistic option. This is a pre-engineered system that’s designed and fabricated off site and then installed at the job site or at the flue fabricator’s shop.

Insulation Pins and 22 Gage Sub-girt

This system utilizes a 22 gage sub-girt plug welded to the external stiffeners, with the insulation and lagging then installed. The insulation and lagging will be attached to the sub-girt by a separate support system (pins, clips, Z clips, and or sub-girt). This is a field fabricated and designed system either at the job site or at the flue fabricator’s shop.

Pre-insulated Lagging Panels

This system consists of a shop or field fabrication of an insulated lagging panel. This insulated lagging panel will then be attached to the outside of the stiffeners directly or to a sub system made from angle iron. This is a pre-engineered system that can be fabricated at the job site or at an off site facility and can be installed at either the job site or at the flue fabricator’s shop.

Final Thoughts

To insulate an SCR system, a combination of one or more of the previously mentioned insulation and lagging systems will be required. This will be very expensive, especially when you compare them to the insulation system of years gone by (one layer of insulation and lagging).

An average SCR system being installed at an existing power plant may cost as much as $50 million (including insulation and lagging). An improperly designed and/or installed insulation and lagging system will have an adverse effect on the SCR’s ability to operate correctly.

No longer is it economically feasible to bury or hump stiffeners. So it will pay to pay attention to the insulation and lagging design. Stiffeners more over 7 inches high are very difficult to insulate and lag economically. So look at the water gauge requirements of your SCR project and before a stiffener design is set, consider what type of insulation and lagging system that will be utilized on the SCR system. Planning ahead will save money. A well designed and installed insulation and lagging system will save money and energy at a rate that’s essential for an efficient plant operation.

For the insulation of hot objects-especially large-dimensional ducts such as those found in nuclear power plants, flue gas desulphurisation and denitronisation systems-reinforcing stiffeners on the duct wall must always be considered thermal bridges. Because of this, two problems result:

  • The increased thermal transmission through the thermal bridge leads to reduced temperatures at the inner surface of the duct wall. This may lead to going below the dew point temperature of the flue gas on that inner surface. Such a situation isn’t considered in this article.

  • With unacceptably high temperature differentials between the inner and the outer edge of the stiffeners, thermal stress may result, leading to distortion of profiles and cracking of welded seams. For this reason, it’s common to calculate and maintain maximum admissible temperature differences through an appropriate construction and dimensioning of the insulation.

The limitation to the demanded temperature differences doesn’t constitute a problem in steady-state service, such as with flue-gas temperatures not changing over time as long as the required insulation material coverage on the outside of the stiffeners – 1/3 s for stiffeners up to 100 mm, 2/3 s for stiffeners over 100 mm – is observed.

Difficulties, however, may occur in the non-steady-state service-where flue-gas temperatures change over time as the installation is started up or shut down.

Starting the installation, the temperature on the inner surface of the wall and the inner edges of the reinforcing stiffeners follows the increasing flue gas temperature, while the outer edges of the stiffeners remain cold and the temperature there increases only after a considerable delay. This may lead to temperature differentials substantially above those in steady-state service.

The magnitude of these "non-steady-state temperature differentials" is dependent upon a variety of factors:

  • the speed of temperature increase in the flue gas; the faster the installation started, the higher the temperature differences

  • size of the stiffeners: with big profiles and large masses, the temperature differences are higher than with small profiles

  • shape of the reinforcing stiffeners

  • thermal conductivity of the materials used

  • thermal transmission conditions

To lower the temperature differences, measures must be taken to allow for the movement of as much heat as possible through radiation and convection from the duct wall to the outer edge of the reinforcing stiffeners. This may be achieved-if technically feasible-by leaving an ample portion of the duct wall uninsulated.

These and other measures in the insulation area are, however, of limited effect. With big reinforcing stiffeners, the steady-state temperature differences can’t be reduced to acceptable values even through "the best possible insulation." Therefore, other measures outside of the control of the insulation trade are required. These may include using several smaller stiffeners instead of one large one, or reducing the rate of temperature increase when starting up the installation.

Principal Considerations

Depending upon the individual design, the temperatures in reinforcing stiffeners are influenced by the shapes and the appropriate insulation material design values. Some observations of principle can be made for the design examples given in Figures 1 and 2.

The simple reinforcing fin (steel sheet; generally smaller than 100 millimeters) would generally have roughly equal temperatures at the inner and outer edges, providing the insulation material coverage d was sufficiently extensive. In this case, no elevated thermal stress occurs. The "dew point temperature problem" on the inner surface of the duct wall, however, must also be considered in this case.

Contrary to this example, the temperature on the outer edge of the normally bigger I-profile (double T-profile – generally with webs exceeding 100 millimeter) definitely be lower than of the inner edge, since bigger masses must be heated on the outer edge and the heat transport requires more time due to the length of the web.

Frequently, the insulation contractor is required to mathematically prove what type of temperature differentials are-normally calculated against known warming-up conditions in the initial phase of the installation. Such calculations can be computed with numerical procedures such as the finite difference or the finite element method. However, it must be remembered that with these methods the thermal transmission inside the stiffener can be calculated satisfactorily exact. However, assumptions must be made regarding the movement of heat through radiation and convection, the precision of which is frequently difficult to assess. This applies especially to radiation. Here, the surface conditions of the duct wall and the reinforcing stiffener are decisively important. They aren’t known to the insulation contractor with the required precision. Therefore, caution should be used in the declaration of warranties on the basis of such calculations.

Example

For the insulation following the surface of the profile IPE 360 as in Figure 2a, some results of finite element calculations are listed. Figures 3 shows the temperature increase over time at an uninsulated duct wall, the inner and outer edges of the reinforcing flange when the warming-up transient is 1.6 K/min and 0.4 K/min.

The maximum occurring temperature differences for a profile IPE 400, insulated according to Figure 2a, is given for different warming-up transient and for the steady-state service in Table 1. Table 2 shows the maximum temperature differences for I-profiles, insulated with "air gaps" according to Figure 2b.

The results show that especially while warming up the installation, critical stress maxima must be expected. The warming-up gradient has decisive influence here.

A comparison of the two designs considered here makes it obvious that the result of "air-gap" insulation compared to the surface-following insulation is smaller temperature differences for both the steady-state and the non-steady-state conditions. These observations, however, only hold true when uncontrolled convection influence can be prevented.

Conclusions

For the insulation of large-dimensional, hot objects, special thermal conduction considerations are required. Additionally, investigation of the possible deformation in the stiffeners as a result of temperature differentials is needed. This applies specifically to non-steady-state service conditions such as start-up and shut-down phases and accidents.

A mathematical proof of the maximum occurring thermal stresses in the steel construction of an object is not within the area of responsibility of the insulation contractor. The static system selected and the static and dynamic stresses to be born by the construction are in the area of responsibility of the installation contractor.

Nevertheless, this problem should be addressed when discussing contracts and the builder should be made aware of it. It could be possible that there is a duty to caution against possible damages, if the thermal stresses to be expected as result of the layout and size of the reinforcements and the temperature differences to be expected could lead to damages.

In critical cases, the necessity may even occur to ensure an even distribution of heat at the outer edges of the reinforcement in the warming-up phase of the installation by installing an extra heating system.

The European Federation of Associations of Insulation Contractors (FESI) is based in Berlin, Germany, with member organizations in 17 European countries. Among its goals are to promote the interests of insulation contractors in its member associations, and to establish its "opinion leadership" in all technical matters related to thermal and cold insulation and acoustic protection, both in buildings and in building equipment and industrial installations. For more information on FESI, contact (30) 2 12 86-1 62/-1 63, or e-mail to: bfa.wksb@bauindustrie.de.

Table 1: Temperature differences in stiffeners with insulation following the surface (according Figure 2a)
Steady-State Non-Steady-State
Initial temperature = +40 °C

Profile Temperature difference
in stiffeners

= DJ[K]
Profile Temperature differences in stiffeners = = DJ[K] Initial temperature
K/min
(temperature transient)
IPE 400
Table 2: Temperature differences in flanges with "air-gap"-insulation (according Figure 2b)
Steady-State Non-Steady-State
Initial temperature = +40 °C

Profile Temperature difference
in stiffeners

= DJ[K]
Profile Temperature difference in stiffeners = = DJ[K] Initial temperature
K/min
(temperature transient)
IPE 400 about 10 IPE 400 about 50-60 1.6
    – ” – about 40 0.8
    – ” – 90 2.0
IPE 460 about 10 IPE 460 75 1.6
    – ” – 50 0.8
HEA 300 about 10 HEA 300 57 1.6
    – ” – 45 0.8
IPE 370 about 10 IPE 370 53 1.6
    – ” – 34 0.8
IPE 300 about 10 IPE 300 45 1.6
IPE 270 about 10 IPE 270 42 1.6

In mechanical insulation audits, there are many areas of opportunity for potential savings and payback for customers. My interest in the energy appraisal business started by realizing the amount of energy and emissions that are lost "up the stack" at many different facilities. I invested in equipment and time developing a comprehensive report, and utilizing the 3E Plus program with information to provide accurate documentation to the customer. The documentation provides data in which the reduction of fuel required to achieve the same amount of energy brings the following correlation; less fuel equals less emissions and less disposable solid waste. The reduction of green house gas emissions, i.e. sulfur dioxide, nitrogen oxides and carbon dioxide is a direct result of less fuel used to generate power. Landfill usage is also lessened, because solids such as fly ash (which comes from unburned fuel sources after combustion is made in the boiler) is greatly reduced.

Over many years of site visits in the industrial market it’s quite unsettling to find so many incorrect applications and poorly installed insulation systems. It’s also very frustrating, as an insulation contractor, to come in second only because the "successful" bidder didn’t follow industry standards in the evaluation of the project, therefore creating an uneven playing field. The customer also suffers a loss by accepting an insulation application that may not fit the original intent of the design criteria.

The following are considerations that must be made to develop a basis for conducting an audit:

Type of Facility

The type of facility will determine the next steps in conducting the appraisal. In power generation facilities it’s important to determine the fuel source used. Coal, natural gas and wood, to name several, will determine the types of emissions that will be evaluated.

Emissions such as sulfur dioxide and carbon dioxide are commonly evaluated, based on the type of fuel used to produce electricity or steam. I have found in certain regions that the facility pays for permits, allowing a certain volume of monitored emissions. The fee is adjusted accordingly for anything in excess of that permitted amount. This fee then becomes a part of the monies involved in the savings realized in an audit report.

Type of Fuel

The type of fuel has certain BTU ratings and emission factors that are entered into formulating specified cost savings and emission reductions based on the difference between insulated verses uninsulated surfaces as determined in the report. The fuel cost per BTU, generally obtained from the customer, must be entered into the audit to establish the money saved, or positive cash flow, after the insulation improvements are completed. The fuel cost must include conversion efficiency (from fuel to heat) and operational expenses. There are additional components of determining fuel costs that may be added into the report regarding tax and interest rates, capital investment rate, and fuel inflation rate. Cooling plants require additional information regarding depreciation rates and coefficient of performance, cooling make-up water cost per gallon and water inflation rates.

Fuel Efficiency

Additional information that further strengthens the case for an energy audit is that a typical power plant operates at 30 percent to 35 percent fuel efficiency. A typical boiler operates at 50 percent efficiency. Most energy contained in gas or oil used to fuel a power plant doesn’t end up at the generator bus bar (electrical box). The life of the equipment required to produce so much energy is also improved. This lowers maintenance costs and frequency of equipment replacement, along with pollution control modifications.

Employee Comfort and Safety

Another consideration is the comfort level and safety for employees within the facility. If you are sweating profusely during the preliminary walk-down, this may be a good indicator that heat is being released beyond the insulation systems in place. If an employee is working in this type of uncomfortable environment, their production level is more than likely hampered by the excess heat. This could be considered another variable in providing a better return on an insulation improvement investment.

Appraisal Process

The appraisal process begins with marketing: Identifying the type of business that would require large amounts of energy to produce or refine a particular product, such as electricity, petroleum, plastics, steel, aluminum, food products, packaging and paper. The next step is to identify what level of personnel to approach. This requires personnel that are cognizant of the daily operations of the facility, such as a plant engineer or plant manager. It becomes more apparent that the upper level management such as the chief executive officer or controller of the facility has the resources available regarding capital financing decisions and realizes that for every dollar saved on energy, pollution control requirements and safety could be applied to the bottom line. The appraisal consists of these basic steps.

1. A preliminary site evaluation of the mechanical insulation systems is conducted. This evaluation determines if a detailed audit is even applicable for the facility. A site walk-down, with a plant representative that’s knowledgeable of the plant layout, is needed to understand the basic systems involved. Typically, non-insulated steam and condensate systems provide the highest rate of return. This walk-down is best performed when the systems are in operation, as the infrared gun used can easily detect the heat losses in the system, thus identifying potential insulation failures. A visual inspection is conducted to note either under-insulated or uninsulated piping, valves and/or fittings. Hot gas ductwork and/or related equipment utilized in the heat recovery process also provides opportunity for additional savings areas. Boilers, sidewalls, headers, hoppers, economizers, turbines and other components of power or process production are evaluated for potential insulation improvements.

In some cases it may become apparent that the level of maintenance and insulation design was sufficient and a reasonable return on any insulation improvements, weren’t evident. A prudent decision must be made at this point to inform the customer if a fully detailed audit is required at their facility or determining that an audit wouldn’t benefit the customer with a reasonable payback period.

2. The next step is to identify the scope of the audit. This process starts as part of the initial walk-down, as described earlier, from areas that were noted and discussed with the facility representative as an opportunity for savings. Generally, these potential areas of improvement may be noted.

Types of under-insulated or noninsulated systems:

  • installation of a condensing economizer to recover heat from boiler flue gas

  • implementation of a steam trap survey and repair program

  • implementation of a plant wide energy metering and reporting program

  • a survey of all piping, tanks, valves and components to determine the condition of insulation and an extensive program to insulate all uninsulated equipment

Once these items are referenced and charted, measurements must be documented. The size of the pipe, equipment, and/or ductwork areas are critical in calculating the potential energy losses and emissions. Readings of temperatures are obtained through the use of temperature guns, infrared cameras and contact thermometers, or utilizing engineering data that accurately details the operating (not design) temperatures of the system. I utilize an infrared camera for documentation purposes. In understanding a thermograph image, practice is required to comprehend how to interpret certain conditions and the readings on the imaging process. It’s very important in understanding the emissivity factors on the insulation finishes or bare metal on piping or equipment surfaces. The readings may be greatly affected because of the reflective properties of the surface being analyzed. The emissivity settings also apply to the use of an infrared heat detection gun. Incorrect settings may give false temperature readings of as much as several 100 degrees fahrenheit.

Areas indicating a specific heat loss should be noted and identified, if possible, with a photo image and an infrared image. This type of documentation lends additional credibility to the final report. Every lineal foot of a steam or condensate line doesn’t have to be photographed for reporting purposes. However, the size and footage must be noted. Items of photo documentation may include pressure reducing stations, equipment access doors, valves, bonnets, vessel components, or specific areas of concern.

3. The site conditions must be documented for insulation calculation purposes as well as extensions of the energy saved results.

  • What are the "degree days" for that region, average wind speed, ambient temperatures inside and out during the data collection time?

  • What is the type of fuel used at the facility.

  • The location of the specific work area must be defined (Elevation above grade or floor, confined space, accessibility).

  • Are the systems being audited indoor or outdoor?
  • Is the process operational all year or is it seasonal?

This information is considered necessary for determining productivities and developing a more accurate insulation price, if the work is to be performed by a qualified contractor.

4. Quantification of the under-insulated or noninsulated pipe or equipment is required for completion of the report. The results of the data collected for the temperature differential must be used in determining the BTU’s saved from a bare surface to an insulated surface. These calculations are used in establishing an insulation estimate and providing insulation types and thickness for the noted temperatures and conditions.

5. The next phase is creating an audit report format. This is an important and time-consuming element of the audit report process. It requires a layout that allows the customer to easily identify and locate the components of the actual site survey. This level of detail gives credibility to the audit report, showing the customer familiar check points that can be located by the careful selection of grid marks or identification numbers. The use of orthographic drawings, process and instrumentation diagrams, and specifications prove to be very helpful as reference points of the report, as well as reducing on-site related take-off work.

6. The insulation selection: The type of insulation and finish for a particular application for steam, hot water and chilled water, to name several, must be established to provide the customer with a possible solution for determining corrective actions reflected in the report. Those familiar with insulation industry standards understand that selection of insulation types, application methods, labor market and other variables can greatly effect pricing provided in an audit or estimate. This is where experience as an insulation estimator is very beneficial to obtaining accurate cost information intended for the audit.

7. Data must be entered into different formulas or programs to provide heat loss and emission loss results. As mentioned earlier, the 3E Plus program that was designed and distributed for use by the Department of Energy and the North American Insulation Manufacturers Association (NAIMA), has proven to be an excellent tool in obtaining results for the audit. The individuals who meticulously developed this program should be recognized for this exceptional work. This information must be linked to deliver the end result in an understandable format. The cost to insulate the system must be determined, thus showing a comparison of energy saved (converted to dollars) versus estimated insulation costs. After this information is documented, the "payback period" may then be calculated. Payback period is figured by dividing the cost of the insulation upgrade by the amount of energy saved.

Additional Information

In addition, the report should contain information that indicates type of equipment used in the survey i.e.; temperature measuring tools, types of cameras (digital and infrared used for documentation. Qualify the report indicating labor market considerations, insulation application types and calculations used to determine the BTU loss/ gain showing equations applicable to the audit.

Figure 1 (tank farm; see link) is a portion of documentation contained in my audit of the Unilever Edible Oil Plant in Toronto Canada, and the results of a food oil process plant.

Simple Concept

It’s really a very simple concept in understanding the benefits of having a mechanical insulation audit performed at a facility. Inadequate insulation or noninsulated systems costs energy and dollars. The information contained in the audit may also aid the customer in preparing a scope of work for future insulation bidding purposes and provides budget information.

Figure 1
Figure 2
Figure 3
Figure 4
Figure 5

In Webster’s Dictionary, power has several definitions. Among them: the product of the effective values of the voltage and current with the cosine of the phase angle between current and voltage in an alternating-current circuit. Or, to define it in more layman’s terms: strength or force exerted or capable of being exerted.

In 2001, the topic of power has been, well, powerful. Rolling blackouts in California brought the energy and power issue to the forefront. For President Bush, it’s been a major theme in his first year in office, and the administration’s energy policy has generated considerable debate. For the insulation industry, trends in power and energy could have an impact on potential business opportunities in coming years.

The Power Generation

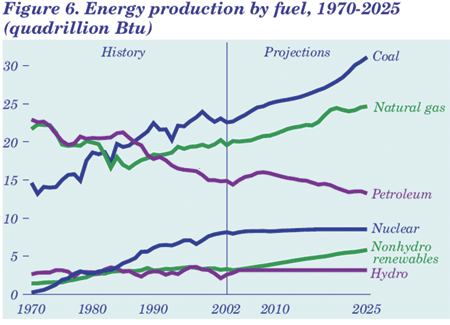
What is the outlook for energy in the next two decades? The Energy Information Administration says growth in electricity demand in the next 20 years is projected to be slower than in the past, but that 393 gigawatts (billions) of new generating capacity (excluding co-generators) is still expected to be needed by 2020 to meet growing demand and to replace retiring units. Between now and 2020, 26 gigawatts (27 percent) of current nuclear capacity and 43 gigawatts (8 percent) of current fossil-fueled capacity are expected to be retired. Of the 162 gigawatts of new capacity expected after 2010, 16 percent will replace retired nuclear capacity.

The projected reduction in baseload nuclear capacity is expected to have a modest impact on the electricity outlook after 2010: 51 percent of the new combined-cycle and 15 percent of the new coal-fired capacity projected in the entire forecast are expected to be brought on line between 2010 and 2020.

Before the advent of natural gas combined-cycle plants, fossil-fired baseload capacity additions were limited primarily to pulverized-coal steam units. However, efficiencies for combined-cycle units are expected to approach 54 percent by 2010, compared with 49 percent for coal-steam units, and the expected construction costs for combined-cycle units are only about 41 percent of those for coal-steam plants.

As older nuclear power plants age and their operating costs rise, 27 percent of currently operating nuclear capacity is expected to be retired by 2020. More optimistic assumptions about operating lives and costs for nuclear units would reduce the projected need for new fossil-based capacity and reduce fossil fuel prices.

1,300 New Power Plants May Be Needed by 2020

Before building new capacity, utilities are expected to use other options to meet demand growth-maintenance of existing plants, power imports from Canada and Mexico and purchases from co-generators. Even so, assuming an average plant capacity of 300 megawatts, 1,310 new plants with a total of 393 gigawatts of capacity (excluding co-generators) are projected to be needed by 2020 to meet growing demand and to offset retirements. Of this new capacity, 92 percent is projected to be combined-cycle or combustion turbine technology, including distributed generation capacity, fueled by natural gas. Both technologies are designed primarily to supply peak and intermediate capacity, but combined-cycle technology can also be used to meet baseload requirements.

According to EIA, nearly 22 gigawatts of new coal-fired capacity is projected to come on line between now and 2020, accounting for almost 6 percent of all capacity expansion expected. Competition with low-cost gas-turbine-based technologies and the development of more efficient coal gasification systems have compelled vendors to standardize designs for coal-fired plants in efforts to reduce capital and operating costs to maintain a share of the market. Renewable technologies account for 2 percent of expected capacity expansion by 2020-primarily wind, biomass gasification and municipal solid waste units. Nearly 13 gigawatts of distributed generation capacity is projected to be added by 2020, as well as a small amount (less than 1 gigawatt) of fuel cell capacity. Oil-fired steam plants, with higher fuel costs and lower efficiencies, are expected to account for minimal new capacity in the forecast.

Gas- and Coal-Fired Generation Grows as Nuclear Plants Are Retired

As they have since early in this century, coal-fired power plants are expected to remain the key source of electricity through 2020. In 1999, coal accounted for 1,880 billion kilowatt-hours (kwh), or 51 percent of total generation. Although coal-fired generation is projected to increase to 2,350 billion kwh in 2020, increasing gas-fired generation is expected to reduce coal’s share to 44 percent.

Environmental Concerns

Concerns about the environmental impacts of coal plants, their relatively long construction lead times and the availability of economical natural gas make it unlikely that many new coal plants will be built before about 2005. Nevertheless, slow growth in other generating capacity, the huge investment in existing plants, and increasing utilization of those plants are expected to keep coal in its dominant position. By 2020, it’s projected that 11 gigawatts of coal-fired capacity will be retrofitted with scrubbers to meet the requirements of the Clean Air Act Amendments of 1990.

In percentage terms, gas-fired generation is projected to show the largest increase, from 16 percent of the 1999 total to 36 percent in 2020. As a result, by 2004, natural gas is expected to overtake nuclear power as the nation’s second-largest source of electricity. Generation from oil-fired plants is projected to remain fairly small throughout the forecast.

the next generation

Technology advances boosting efficiency, environmental protection in plants

Several new power plants with advanced generating technology are currently coming online. These plants, including those powered by fossil fuel and renewable energy sources, promise to generate electricity more efficiently and with less impact on the environment, according to the Edison Electric Institute. This story provides an overview on some of the next generation power plant technologies, as well as a look at some of the new plants coming online.

Renewable Energy Technologies

Solar

Newly designed solar electric cells at the Golden (Colo.) National Renewable Energy Laboratory surpass other cells in the percentage of sunlight they change to electricity: 16.4 percent versus 15.8 percent. The efficiency of a solar cell is calculated as the percentage of available sunlight the device converts into electricity.

Wind

The next generation of wind turbines are targeted for sites with moderate wind speeds. Technology advances enable these turbines to capture more energy from the wind, minimize damaging structural loads and optimizing power produced in constantly varying wind conditions.

Hydropower

The hydropower industry and the U.S. Department of Energy (DOE) are developing "fish friendly" turbines through the Advanced Hydropower Turbine System program. Advanced turbine technology could reduce fish mortality resulting from turbine passage to less than 2 percent, in comparison with turbine-passage mortalities of 5 percent to 10 percent for the best existing turbines. The technology could also improve water quality by maintaining downstream dissolved oxygen levels of at least 6 milligrams per liter.

Fossil Fuel Technologies

Coal

Coal now generates more than 50 percent of the country’s electricity. The technology focus has been on making this mainstay of electric power generation cleaner and more efficient. Some key goals are low-cost production of electricity, process heat, and high-value fuels and chemicals from a multiplicity of feedstocks (e.g., coal, biomass, and wastes); virtually no pollutant emissions; and efficiencies greater than 60 percent.

Natural Gas

For both environmental and economic reasons, the U.S. Energy Information Administration (EIA) reports that almost two-thirds of new capacity brought online from 1996 through 1998 (the latest data available) was fired by natural gas or a combination of gas and oil. Likewise, of the 300 gigawatts of new capacity that the country will need by 2020, EIA expects some 90 percent to be fueled by gas. DOE’s utility-scale Advanced Turbine System’s objectives are to achieve 60 percent efficiency or more in a combined-cycle mode, with NOx emission levels less than 9 parts per million, and a 10 percent reduction in the cost of electricity.

Advanced Power Plants-Sample Projects

In June 2001, Reliant Energy broke ground for the first major coal-based power plant to be built in Pennsylvania in 20 years. The $800 million, 520-megawatt Seward Power Plant in Indiana County will use a "clean-coal" technology called circulating fluidized bed (CFB) to burn waste coal while meeting stringent environmental requirements. The new plant, starting up in 2004, will replace an 80-year-old, 200-megawatt facility scheduled to close in late 2003.

Tampa Electric Company, as part of a major expansion over the next decade, has built a 250-megawatt integrated gasification combined-cycle (IGCC) facility in Florida. Polk Power Station, Unit 1, began commercial operation in September 1996. Since then, the unit has logged more than 15,000 hours and produced more than 3.5 million megawatt hours of electricity on syngas.

In West Virginia, Dominion and Anker Energy Corporation jointly announced plans to develop a new coal and coal waste-fired electric power station and mining complex in Upshur County. Under terms of an agreement between the two companies, Dominion would construct, own, and operate the 450-megawatt station, which would utilize state-of-the-art "clean coal" technology and would burn more than 65 percent coal waste. Anker Energy would provide all of the facility’s fuel from on-site surface mining operations.

FPL Energy, LLC, the largest wind generator in the U.S., recently began operation of a 30-megawatt wind farm near Madison, Wisc. The farm features 20 turbines, each capable of producing 1.5 megawatts. FPL Energy, a subsidiary of FPL Group, Inc., has an installed wind generating capacity of 600 megawatts and expects to complete additional projects totaling more than 800 megawatts by the end of 2001, including 438 megawatts in Texas, 110 megawatts in Kansas, and nearly 300 megawatts along the Washington-Oregon border.

Wavegen of Inverness, Scotland, constructed the first commercial-scale plant powered by ocean waves, the land installed marine powered energy transformer (LIMPET), in December 2000. As seawater enters or leaves an inclined concrete tube, it alternately compresses or decompresses air inside the tube. This air movement spins pneumatic turbines, which then generate electricity. The turbines spin in the same direction, regardless of which way the air flows.

Sources for these stories were the Energy Information Administration, the Edison Electric Institute and the North American Electric Reliability Council.

Developing construction specifications to ensure compliance with energy standards is sometimes a source of confusion for specifiers of metal buildings. Insulation manufacturers often receive questions similar to the following:

"What R-value of insulation do I need to comply with my local energy code?" The answer, of course, is, "It depends."

The thermal performance of building envelopes depends on more than just the R-value of the insulation installed. For metal buildings in particular, the influence of metal components such as purlins, girts, sheeting and fasteners can have a significant impact on the overall thermal performance. Fortunately, energy standards are beginning to recognize this and are incorporating information specific to metal buildings in their envelope requirements.

Developing specifications that comply with energy standards involve the following steps:

  • identifying the U-factor requirements based on the building’s location and use

  • selecting envelope designs which meet the U-factor requirements

  • specifying the use of insulation materials with assured performance

    ASHRAE 90.1 – 99

    The American Society of Heating, Refrigerating, and Air-Conditioning Engineers has approved Standard 90.1-1999, "Energy Standard for Buildings Except Low-Rise Residential Buildings." This is the latest revision in the 90 Series originally published in 1975. The 1999 revision (available for order at www.ashrae.org) is significant in that, for the first time, metal building walls and roofs are treated as distinct envelope elements.

    Also for the first time, the standard establishes envelope criteria based on life cycle economics. The previous version, published in 1989, established maximum U-factors based on the consensus professional judgment of the standards committee and didn’t differentiate metal buildings from other commercial construction types.

    The revised standard establishes criteria for metal building walls and roofs for each of the 26 climate zones defined by heating and cooling degree-days. The criteria are based on cost and performance estimates of actual constructions so that the prescribed criteria are achievable and cost effective.

    The ASHRAE Standards Committee utilized data originally publicized by the North American Insulation Manufacturers Association in the brochure, "ASHRAE 90.1 Compliance for Metal Buildings." The document is available through NAIMA and may be ordered through its Web site (www.naima.org). NAIMA members also consulted with the 90.1 standards committee in developing the revised standard.

    U-Factors

    As in previous versions of the 90.1 Standard, the envelope thermal performance criteria for walls and roofs are expressed as maximum U-factors. The U-factor is the overall heat transfer coefficient of the envelope element. It’s understood to include air films on both inside and outside surfaces, and it accounts for all the construction details of the building element being described. Units are Btu/(hroft2o°F). By convention in the building industry, U-factors are evaluated at a mean temperature of 75 degrees fahrenheit. For horizontal elements (floors and roofs) Standard 90.1 specifies that they be evaluated assuming the heat flow direction is up (normally the worst case). In steady state, the heat loss or gain through an envelope element can be calculated by multiplying the U-factor by the area and by the temperature difference between inside and outside air.

    The goal is to describe, in a single term, how real insulation systems perform as installed in real buildings. Unfortunately, real buildings are complicated. Temperatures (both inside and out) are very seldom steady enough to permit accurate heat flow measurements. Solar gains, air infiltration, lighting loads and occupancy effects complicate the situation further. For metal buildings, the thermal performance is further complicated due to the abundance of highly conductive metal components. Thermal short circuits due to fasteners and compression of insulation over purlins and girts contribute to the thermal system’s complexity. NAIMA’s approach was to develop U-factors for metal building insulation systems based on a combination of hot box testing and three-dimensional finite element analysis of metal building insulation systems.

    Finite Element Analysis

    Finite element analysis is a numerical method whereby a complicated geometry can be mathematically modeled by dividing the region of interest into many small "elements." This essentially turns a complicated problem into many simple problems that can be solved by iteration using a computer. FEA software (such as the ANSYS package) is routinely used in many industries to solve a variety of complex thermal problems. Using FEA, it’s possible to properly account for the thermal complexities of metal building envelopes and to develop accurate U-factor estimates. A validated FEA model can be used to investigate many more cases than would be possible with hot box testing alone.

    The FEA model was validated using hot box testing to verify the assumptions involved. In these tests (performed per ASTM Test Method C 976) a representative section of a metal building roof was constructed in an opening between a hot "metering chamber" and a cold "climatic" chamber. Metering section size was 8 feet by 8 feet. Steady temperatures were maintained on both the hot and cold side of the box, and energy flow into the hot side was monitored accurately. The method has proven accurate, but these tests are costly, time consuming, and require considerable skill to produce accurate results, particularly for highly insulated or geometrically complex constructions.

    Thermal Performance of Metal Building Roofs

    The validated finite element model was used to calculate U-factors for a number of metal building wall and roof configurations insulated with traditional faced mineral fiber insulation. Table 1 gives selected results for roofs:

    As in any modeling effort, the results will vary depending on the assumptions. Key assumptions that apply to these results follow.

    • faced insulation is NIA 404 certified

    • emittance of facing is 0.9

    • 8 inches tall by 3 inches wide purlin and girts (0.0625 inch steel)

    • 5 foot purlin spacing

    • 0.026 inch roof sheet

    Key assumptions for screw down roofs:

    • #12 steel screws

    • fastener spacing 12 inches o.c.

    • insulation compressed to 1/8 inch between purlin and roof sheet

    Key assumptions for standing seam roofs:

    • 24 inch clip spacing

    • 1/4 inch steel screws with rubber washers

    • insulation compressed to 3/4 inch between purlin and thermal block

    • insulation compressed to 1/8 inch under clips

    • 1 inch by 3 inch extruded polystyrene thermal blocks

    These assumptions were felt to apply to typical metal building roof constructions.

    Discussion

    Table 1 includes a column that gives the percentage reduction in heat flow through the roof compared to the uninsulated case. As we know, insulation systems follow the law of diminishing returns. The first increment of insulation produces the largest return, with additional increments reducing heat flow further, but by smaller amounts. This is clearly shown in the table. Determining the "optimal" insulation level becomes an engineering economics problem, which attempts to balance the incremental installed cost with the incremental dollar savings generated over the life of the project. Standard 90.1 utilizes this approach in setting the U-factor criteria for the various climatic zones.

    For screw down roofs, the compression of the insulation between the purlins and the roof sheet has a major impact on the thermal performance of the system. In addition, metal fasteners are a significant short circuit for heat transfer through the envelope. The FEA model properly accounts for these details. Even with these defects, reductions in heat flow of roughly 90 percent (compared to the uninsulated case) are possible.

    U-Factors Better for Standing Sean Roofs.

    For standing seam roofs, the U-factors are significantly better (lower) than for the SDR roof with the same nominal insulation value. This is primarily due to the inclusion of the 1 inch by 3 inch thermal spacer block placed over the purlins where the insulation is compressed. The block is an effective fix for the thermal short circuit at the purlins. Thermally, the SSR with the thermal spacer block is a much more efficient system that should be considered in colder climates. Using double layers of insulation, U-factors down to 0.046 Btu/(hroft2o degrees fahrenheit) are achievable (a 96 percent reduction compared to the uninsulated baseline).

    Finally, note the results for filled cavity insulation systems. For most metal buildings, the vapor retarder facing and the insulation layers are installed from the top of the roof prior to installation of the roof sheeting. This method leaves the purlins exposed to the indoor conditions below. Other installation approaches use banding to support the insulation from below the purlins. These systems can be used on new buildings, and may be adaptable to re-insulation work in existing buildings. The approach has the additional advantage of allowing the insulation to completely fill the cavity between purlins. While the thermal short circuit of the steel purlins is still present, its effect is reduced.

    Thermal Performance of Metal Building Walls

    Table 2 summaries the FEA results for selected metal building walls installed in the conventional manner. These calculations assumed a girt spacing of 7 feet.

    As expected, the results are somewhat lower than the U-factors for screw down roofs, reflecting primarily the wider girt spacing assumed.

    Insulation Material Specifications

    In developing these U-factors, one key assumption was that insulation material installed performs as designed. To ensure this, the construction specification should require that insulation materials comply with National Insulation Association (NIA) Standard 404. NIA 404 is a standard product specification for flexible faced fiberglass metal building insulation. It was developed by NIA’s MBI Laminators Committee (www.insulation.org), and it covers the composition and physical properties of faced insulation intended for use in the walls and roofs of metal buildings. The standard requires that the thermal performance of the laminated insulation product meet the rated R-value out of package, with verification by periodic sampling and testing by a nationally recognized laboratory.

    The revised ASHRAE Standard 90.1-99, for the first time, treats metal building walls and roofs as distinct envelope elements. Maximum U-factor criteria are set based on life cycle economics. The NAIMA three-dimensional finite element model was used to estimate the thermal performance of typical metal building envelope elements, taking into account compression of insulation at the purlins and girts as well as thermal shorts due to clips and fasteners. The resulting U-values are published in Appendix A of the 90.1 Standard and may be used to demonstrate compliance of the design. Specifying NIA 404 compliant insulation materials ensures that the wall and roof assemblies perform as designed.

    Table 1

    Assembly U-factors for Metal Building Roofs

    Insulation System

    Nominal

    R-Value

    U-factor

    Btu/(hr? ft2?Deg F)

    Percent Reduction

    from Uninsulated

    Case

    None

    0

    1.28

    Standing Seam Roof

    10

    0.153

    88.0


    11

    0.139

    89.1


    13

    0.130

    89.8

    Screw Down Roof

    10

    0.097

    92.4

    With Thermal Blocks

    11

    0.092

    92.8

    (Single Layer)

    13

    0.083

    93.5


    16

    0.072

    94.4


    19

    0.065

    94.9

    Standing Seam Roof

    10/10

    0.063

    95.1

    With Thermal Blocks

    10/13

    0.058

    95.5

    (Double Layer)

    13/13

    0.055

    95.7


    10/19

    0.052

    95.9


    13/19

    0.049

    96.2


    19/19

    0.046

    96.4

    Filled Cavity with

    19/10

    0.041

    96.8

    Thermal Blocks


    Table 2

    Assembly U-factors for Metal Building Walls

    Nominal R-Value

    U-factor

    Btu/(hr?ft2?Deg F)

    Percentage Reduction

    from Uninsulated Case

    0

    1.18

    10

    0.134

    88.6

    11

    0.123

    89.6

    13

    0.113

    90.4

    This article originally appeared in Metal Construction News, published by the North American Insulation Manufacturer’s Association.

  • The power generating industry, like most, has to pay close attention to health and safety issues pertinent to its components. In power generation, each component of the boiler has some special and unique issues (i.e. tubes and pressure parts that must contend with paint or coatings) that must be addressed. Brick, refractory and insulation are no exception. They have very specific health and safety issues and by all accounts, these issues are a factor on just about every type of refractory and/or insulation material available on the market today-not to mention the health and safety issues associated with the materials of products no longer manufactured but still found on existing construction.

    For those in the power generating industry it’s important that they know everything about the health and safety issues involved with products they’re installing at their facilities. They must also familiarize themselves with products that exist on their boilers. For example, when doing a retrofit, it’s imperative to know ahead of time what products were installed on their steam or heat generating units or systems. Ignorance isn’t an excuse and it won’t save money when and if someone breaches an area that has material presenting a health or safety issue for workers removing or operating around the materials.

    Litigation exposure potential can only be removed by educating yourselves and your workers on properly following the health safety requirements for all products, whether they are new or existing. This is especially important in protecting the health and safety of persons working in and around brick, refractory and insulation materials.

    Brick

    During brick installation, crystalline silica dust is created when bricks are cut by power saws. Crystalline silica dust is a serious and potentially fatal health threat. To prevent this, you should use, wherever possible, wet saws to cut the brick to reduce dust. Also, respirators or air masks should be used and exhaust fans will need to be installed (in cases where a heavy volume of brick cutting is being done). Ear and eye protection should always be used due to exposure to the high levels of noise made from the power saws and from flying particles.

    Refractory

    For many years, OSHA has kept the power generating industry informed as to what products have been or might be classified as a carcinogen material. However, those working in and around the industry need to be aware of what, where, and how to protect themselves and those working for them. For example, the Environmental Protection Agency determined that some refractory materials being used in boiler settings contain chromium compounds as part of the refractory mixture. During operation some of the chromium compounds will be converted into a hexavalent chromium. What this means is that the initial refractory material didn’t represent a health problem, but when the refractory is removed it did. During operation of the unit some of the chromium compounds may be converted to CR+6. Thus, when the refractory material is removed, the created dust may thereby transport the hexavalent chromium. Inhaling CR+6 increases the risk of lung cancer and may also cause other health hazards.

    Another serious problem involves those refractory products containing crystalline silica, which, when converted to dust, presents a potential health hazard if inhaled over a period of years. I recommend doing the following when removing or installing refractory material that contained crystalline silica or a chromium base product:

    • Provide training, education and equipment to any personnel who will or may be in contact with the refractory.
    • Provide proper monitoring of the removal process.
    • Wear proper masks to prevent inhaling the refractory dust.
    • Wear proper protective suits to prevent the refractory dust from coming in contact with the skin.
    • Dispose the hexavalent CR3 refractory material in accordance with EPA regulations for disposal of Group 1 toxic substances.

    The previous list is far from complete and there may be many other generic and brand name chromium-containing products that may have been used. It’s very important to check maintenance, purchasing, and supplier records, and also to check the original brick, refractory, and insulation specifications.

    Ceramic Fiber Insulation

    The list of products found and used in the power generating industry on steam-generating boilers includes some ceramic fiber products that contained chrome. Refractory ceramic fiber products do not contain a chrome + 6, but they have been classified per the Seventh Annual Report on Carcinogens as products reasonably anticipated to be a carcinogen based on sufficient evidence for the carcinogenicity of ceramic fibers in experimental animals (IARC V.43, 1988, along with NTP Volume 7, 1994). However, no data has been made available on the carcinogenicity of ceramic fibers to humans (IARC V.43, 1988).

    OSHA regulates ceramic fibers under the Hazard Communication Standard. What this means is that refractory materials in general (those not containing chrome), must be handled with care. The ceramic fibers in the manufactured product are extremely sharp and can cause skin and upper respiratory irritation. The skin irritation can be caused if the broken ends of the ceramic fibers become embedded in the skin. The upper respiratory irritation is a reaction your body has to the sharp ends of the broken fibers.

    To prevent skin and respiratory irritation you should do the following when handling ceramic fiber and refractory materials:

    • Wear long-sleeved clothing and gloves.

    • Wear head and eye protection including respirator or masks to prevent inhaling dust.

    • Wash any exposed skin surface with soap and water after handling the ceramic fiber material.

    • Wash RCF-soiled clothing frequently and separately from other clothing.

    • Refrain from smoking, eating or drinking while working near RCF.

    • Keep RCF work areas clean to prevent accumulation of debris on the floor surface.

    • Use high efficiency particulate air filters for clean-up tasks. If using HEPA filters aren’t feasible, wet sweep or use dust-suppressing compounds.

    • Refrain from using compressed air to clean work clothes and other contaminated surfaces.

    • Refrain from using power tools to cut or drill RCF products.

    I recommend following the above suggestions and also paying close attention to those recommended by the refractory manufacturer’s MSD sheets for optimizing safe handling and installation practices.

    Parting Agents

    Many refractory applications require the application of a parting agent to prevent the refractory from sticking to a tube, pipe or anchor that it’s being used around. Using coal tar emulsion products has become another health and safety issue. Coal tar emulsion products contain ingredients made from crude oil and mineral ores. The ingredients of these coal tar emulsions (i.e. Bitumastic Super Service Black paint) are classified a carcinogen, and appropriate work practice must be used. Once applied, these products represent no health or safety danger, but the initial installation of such products should be avoided.

    Insulation

    Insulation, like refractories and brick, require special handling during installation and/or removal. The fibers that make up any aglassy or vitreous filaments are extremely sharp and can cause skin and upper respiratory irritation. The skin irritation can be caused if the broken ends of the ceramic fibers become embedded in the skin. The upper respiratory irritation is a reaction by your body to the sharp ends of the broken fibers. To prevent skin and respiratory irritation you should do the following when handling insulation:

    • Wear long-sleeved clothing and gloves.

    • Wear head and eye protection, including respirators or masks to prevent dust inhalation.

    • Wash any exposed skin surface with soap and water after handling the insulation material.

    • Wash soiled clothing frequently and separately from other clothing.

    • Avoid breathing the dust when installing insulation products.

    • Use some dust collection method or apparatus to capture the dust, or provide adequate ventilation during installation.

    Follow the previously listed suggestions, along with those recommended by the refractory manufacturer’s MSD sheets to optimize safe handling and installation practices.

    There are many different types of materials manufactured from different minerals. Always check the MSD sheets before installing or handling insulation material. Any insulation material that contains crystalline silica greater than 0.1 percent by weight requires a cancer warning. In addition, breathing dust from such products and materials may cause lung damage. Exposure to the dust may also cause irritation to the skin, eyes, and respiratory track.

    In years past insulation was manufactured using an asbestos base material. Asbestos insulation materials have been classified a carcinogen material. Special attention and careful removal practices must be adhered to for health and safety reasons. Your maintenance, purchasing, and supplier records, along with your original insulation specifications, should be reviewed to determine whether and/or where the asbestos containing products were used.

    Conclusion

    Proper material selection and proper preventive practices, such as knowing your installed materials, will prevent any and all potentially dangerous and health-threatening issues. Read your MSD sheets, review your original bril specifications and always follow OSHA and material manufacturer’s handling and installation recommendations. No one wins in health and safety litigation, because the damage has already been done. Only by paying close attention and by following all health and safety requirements can those working in the power generating industry protect the health and safety of people working in and around brick, refractory and insulation materials.

    To successfully prevent pipe corrosion on cold insulated lines and equipment, it’s important to properly match the materials used to the conditions of the application. When a cold insulation system breaks down and fails, it usually means that the insulation must be replaced, and if the replacement is left unabated, the pipe or equipment may need to be replaced.

    Hot systems may have isolated areas with wet insulation requiring remedial patch work of insulation for corrosion control. Cold insulation systems must deal with water vapor, not just water. This condition separates the hot insulated systems from the cold insulated systems. Before we discuss corrosion, we will first look at the causes of failure to a cold insulation system.

    First, the vapor retarder as specified may have an unsuitable permeance rating for the application conditions. For very cold systems with marginal insulation, the vapor pressure can exceed the capability of the vapor retarder. When insulation systems constantly sweat on the outer surface, it’s a sign that the insulation finish surface temperature is below the dew point. This is when the installed insulation vapor retarder is really being tested.

    Water Vapor Issues

    Water vapor in the air will move from areas of high vapor pressure toward areas of low vapor pressure. The vapor movement rate depends on the permeance of the material through which the vapor transmission takes place. This material may be a mastic system, a membrane finish, the insulation itself or a composite of these materials.

    The driving force of this water vapor pressure is dependent on the variation in the conditions outside the insulation and on the condition at the cold substrate.

    Lets look at a hypothetical condition. The surface of the insulation system is exposed to 90 degrees fahrenheit (32 degrees celsius) and 80 percent relative humidity. According to the Dew Point Table, the dew point is 83 degrees (28C). With an insulation system surface temperature of 60 degrees (16C), using the same RH the dew point temperature is 54 degrees (12C) at this surface. This calculation only applies to the movement of water vapor across the vapor retarder and not from the ambient environment to the pipe surface. We have a condensate (sweating) problem (surface temperature below the ambient dewpoint) and we may also have a vapor transmission problem. The water vapor pressure, in inches Hg. for a dew point of 83 degrees (28C) is equal to 1.14, and with an insulation dew point of 54 degrees (12C), the water vapor pressure at the surface is 0.422. The difference of the two water vapor pressures is equal to 0.718 inches Hg.

    From Fick’s Law on vapor transmission: W equals M A T (Delta P). W equals weight of water vapor in grains (7,000 grains equals 1 pound of water). M equals water vapor permeance through the vapor retarder in grains/feet per square hour inches. Hg (perms).

    For this exercise we will say that the vapor retarder has been tested in accordance with ASTM E96 and is rated at 0.10 perms:

    • A is equal to Area that transfer occurs (square feet.)

    • T is equal to Time (hours)

    • Delta P is equal to Vapor pressure difference (inches of mercury)

    • W is equal to 0.10 x 1 x 1 (1.14 – 0.422)

    • W is equal to .0718 grains of water per hour per square foot.

    This may not seem like much water, but look at it over a period of time and a larger area. Over a period of one year ( 8,760 hours) and a pipe system with 45 square feet (an approximately 8 inch line, 50 feet long).

    • W (total) is equal to .0718 x 45 x 8,760

    • W (total) is equal to 28,304 grains of water

    • W (pounds) is equal to 28,304/ 7,000 equals 4 pounds of water per year.

    Again, this is a hypothetical study and it’s unlikely that the environmental conditions would remain that severe for 12 continuous months. However, it does point out that even with a perfectly installed insulation system, water vapor can permiate into the insulation. To reduce the water vapor permiation by 1/5th the amount under the same conditions, install a vapor retarder with a perm rating of M equals 0.10 /5 equals 0.02.

    The above condition should never occur if proper conditions are specified up front. With the previously mentioned environmental condition, the insulation thickness must be selected to achieve the acceptable surface dew point (condensation control). The 3E Plus® Program will do this for you. As mentioned in a previous article in Insulation Outlook, select a finish that has an emissivity of 0.8 or higher wherever possible. The insulation surface dew point should improve, and possibly reduce the insulation thickness.

    Insulation’s Role

    We have only addressed the virtues of the vapor retarder finish. The insulation can also play a roll in reducing the water vapor transmission to the substrate. Cellular glass insulation has a permeability rating of 0.00 permeance per inch and should eliminate the possibility of vapor moisture migration to the substrate (or at least reduce the water vapor transmission). Foam insulations have permeability ratings that range from 0.5 to 7 permeance per inch, while fibrous insulation is in the area of 100 permeance per inch. The specifier should consider the benefits of the insulation permeability when designing an insulation system for cold service.

    However, all insulation systems have joints that might not be completely sealed, or contraction or vibration of the system can open the joints. Hairline cracks are common in all types of insulation systems caused by handling or securing the insulation to the pipe or equipment. In this writer’s opinion, a good vapor retarder coupled with a low permeability insulation means a cold temperature system will successfully perform for many years. By neglecting to specify the proper vapor retarder and insulation, the entire insulation system will likely have a shortened life. The initial cost of a good vapor retarder and insulation and labor to install it is minimal compared to the total cost of an insulation system that fails and needs to be replaced.

    Using the same conditions as indicated in the previous study, an insulation is rated at 4 permeance per inch. There is an equivalent of 3 square feet of gouges and tears in the vapor retarder. Assuming 1-inch thick insulation and using the above formula, we have:

    • W is equal to 4 x 3 x 8,760 x 0.718

    • W is equal to 75,476 grains of water

    • W (pounds) is equal to 75,476/7,000 equals 10.8 pounds of water over a one-year period from a 3-square foot opening.

    Insulation resistance to vapor moisture does improve the battle against water vapor migration, but the vapor retarder should be the principle deterrent.

    Most building structures have one great advantage over cold operating pipe and equipment: The buildings can breath. The vapor moisture that passes through the vapor retarder, in small quantities can pass through the insulation, the building wall and dissipate into the cold outdoors. Under normal conditions a pre-engineered building with insulated roof and walls may drive 1 pound of water in a week over a 5,000-square-foot area through the vapor retarder under certain weather conditions. This is considered acceptable.

    For cold pipe and equipment, the vapor moisture has nowhere to go but accumulate at the substrate or within the insulation, and if the moisture reaches a temperature of 32 degrees (0C), it becomes ice. This ice will expand and destroy all types and forms of insulation. It will continue to build until the insulation system is completely destroyed all the way to the outside finish.

    Actually, the moisture will seek out someplace to go. Most operating systems are periodically shut down for maintenance. The ice melts and the moisture travels the length of the pipe or equipment between the substrate and the insulation. In short time, the entire insulated system is destroyed.

    Corrosion of the substrate is also a major concern. Austenitic stainless steel pipe and equipment is unlikely to develop stress corrosion cracking (SCC), provided the metal’s temperature is kept cool. This condition generally requires a service temperature above 120 degrees (49C) and general corrosion is very unlikely unless unusual contaminants are in the moisture. However, in cycling service or if the system is periodically cleaned using hot solutions, water or steam, SCC can become an issue. Given the rarity of this, carbon steel pipe and equipment is our major concern.

    Ammonia Issues in Cold Storage

    The ammonia process is the refrigerant of choice for food cold storage and processing facilities. The failure of insulated ammonia systems is more common than one would expect. The operating temperature of these ammonia systems varies between minus 50 degrees and 50 degrees. There is zero tolerance for mistakes in installation of these processes. The American Society of Heating, Refrigerating and Air-Conditioning Engineers (ASHRAE) Handbook on Refrigeration has dedicated an entire chapter (Chapter 3) to this subject.

    ASHRAE states that ammonia is considered toxic at low concentration levels. Ammonia can burn and even explode when exposed to open flame. It can be hazardous to personnel and destroy food products. ASHRAE states that "rusting pipes and vessels in older systems containing ammonia can create a safety hazard."

    In one situation, an ammonia line failed as the result of external corrosion under insulation. The facility was in operation for a short time. The corrosion took place on a 2-inch carbon steel pipe. Inspection of the failure indicated that the point of vapor moisture entry was several feet from where the pipe actually failed. The insulation system on the pipe appeared to be functioning properly. However, there was a break in the insulation as the pipe passed through an interior fire wall. The insulation and sealing system that butted against the fire wall was inadequate. It appeared that there wasn’t compensation for expansion and contraction of the adjacent long pipe run. The only tell-tale sign was a streak of discolored moisture running down the wall, below the pipe. (Photo 1 shows a piece of the pipe cross section that was next to where the failure took place.) It was a schedule 80 pipe with a 1/4-inch wall thickness. The inside diameter of the pipe remained the same. Maximum corrosion took place at the bottom of the horizontal pipe. This is to be expected, since this is where the moisture collected.

    It seems like a simple task to develop a positive method to seal the insulation system at these points but it’s these type locations that usually create serious consequences. For those who believe that any pipe escutcheon (flange) is the answer, take a close look at the design. It may only be for piping that doesn’t move. (Photo 2 indicates a two-piece escutcheon developed by a leading PVC manufacturer.) This design can be sealed to the insulation vapor retarder and the wall. The PVC has the flexibility to compensate for expansion and contraction without breaking the seal at the wall. The escutcheon is molded PVC, 50 mils thick with a permeance rating of less than 0.03, in addition to the vapor retarder under the PVC. There may be other designs or simple methods to address this. However, the problem still exists.

    Not all external corrosion failures to pipe and equipment occur directly on an insulated system. The insulator will terminate the system where there’s an obstruction, such as at a flange or valve. This is standard practice. However, the space between the face of the flange and the terminated insulation may be minimal. Perhaps the bolts may even extend into the insulation butt. The insulator will attempt to seal the exposed insulation with a vapor retarder mastic system. It’s impossible to reach into the tight quarters with a trowel or brush to assure complete coverage (see photo 3, on page 10 and 11). This problem could be eliminated simply by cutting the insulation back a few inches from the obstruction.

    The oxygen-hungry contaminants will corrode away the pipe near the point of insulation termination. The insulation acts as a pond for the water formed from melting ice and is in a position to attract the necessary oxygen. This is why many corrosion failures on pipe will be near the termination of insulation. It’s infrequent to find corrosion under ice, but with moisture and oxygen there’s corrosion. That’s why cycling systems that freeze and thaw are at greatest risk with corrosion

    These insulation terminations, especially on pipe, should be treated as vapor stops. It matters little whether the insulation has a 0 permeability or 100 permeability. The vapor moisture will find its way between the insulation and pipe unless there’s a vapor stop.

    Vapor Stops

    Many specifiers of cold insulation systems have adopted vapor stops at insulation terminations such as at flanges, valves and at directly attached pipe supports, guides and at anchors. Virtually anywhere where the continuity of the vapor retarder is broken the use of a vapor stop is mandatory. Vapor stops are also mentioned in the ASHRAE Refrigeration Handbook, Chapter 32. Some suggest going one step further and installing vapor stops periodically in straight runs of insulation, and at ells.

    A vapor stop is a generous and complete coating of non-setting sealer over the entire butt end of exposed insulation, and onto the pipe and outside diameter of the insulation with a 1-inch lap. If the insulation has a factory applied vapor retarder finish, then overlap the finish and cover with a butt strip. Should the insulation vapor retarder finish be field applied, then apply the vapor stop first and then apply vapor retarder finish over the butt joint. Mastic manufacturers provide a non-hardening butyl sealant that remains flexible to minus 100 degrees (minus 73C). There also may be other non-hardening sealants that work just as well at specified temperatures.

    When specifications indicate that all joints be staggered, including the circumferential joints, then cut the insulation flush wherever a vapor stop is desired. This is no different than installing pipe insulation with a factory applied vapor retarder finish.

    Where double layer insulation is specified with all joints staggered, provide a 6-inch offset at the circumferential joints, and coat the 6-inch inner face and the butt joint with the vapor retarder mastic. Typically only the outer layer of insulation joints are sealed on multi-layer applications. The vapor stop is an exception.

    On cold systems below minus 100 degrees (minus 73C) some specifiers apply a vapor retarder system between an inner and outer layer of insulation. In this case the vapor stop would apply to the outer layer of insulation at the butt joints. At these temperatures, valves, flanges and all obstructions would be completely insulated and sealed. With the non-setting sealer exposed to temperatures below minus 100 degrees (minus 73C) at the insulation terminations, the vapor stop would fail anyway.

    Some insulation fabricators provide ship lap and/or tongue-in-groove circumferential and longitudinal joints on pipe, ell and tee insulation. If the insulation you specify is available with this feature, then it should be considered in the specification for systems operating below 0 degrees F (see photos 4 through 8). This joint treatment will work well with the intermediate and termination vapor stops. Ship lap joints will reduce the need for double layered insulation and contraction joints to much lower temperatures, thus preventing thermal short circuits at a reduced cost. The overall advantages will be dependent upon the type of insulation specified.

    Unfortunately, most cold operating pipe and equipment failures aren’t obvious. The insulation system that covers them makes walk-through inspections of little value. Cold storage facilities generally have their compressors and associated piping on the roof. The industrial plants have their cold facilities outdoors. The roof or ground may be wet from weather conditions or it may be wet from a failed insulation system on a refrigeration system.

    Inspections by maintenance and/or the building superintendent must be thorough and frequent. The inspections must include the insulation, even if it requires installing inspection ports or removing a section of the insulation where corrosion of the substrate is suspect. The walk-through inspection won’t prevent a disaster.

    Summary

    The following is a summary of why we insulate cold operating systems and how we can best prevent a failure from occurring.

    1. Cold piping and equipment are insulated for some of the following reasons

    • to minimize heat gain and improve efficiency, which reduces energy consumption and operating costs

    • to control surface condensation

    • to reduce noise

    • to protect personnel and prevent unsafe ice formations

    2. Measures to prevent corrosion under insulation or adjacent to the insulation

    • Before installing any insulation, all pipe and equipment surfaces must be dry and clean from contaminants and rust.

    • Apply a suitable paint system to carbon steel pipe and equipment. A primer will not prevent corrosion. It must be a submergible type paint system, as indicated in the NACE Standard RPO198-98 Item No. 21084 or ASHRAE Refrigeration Handbook, Chapter 32, Table 1.

    • The coating should also be applied to any exposed area of pipe, including valves and flanges.

    3. Correct insulation system for the process and the environment

    • The insulation must be thermally efficient and of proper thickness to prevent condensation on the surface, except for very unusual high humidity conditions.

    • The specified vapor retarder must be the type to withstand anticipated mechanical abuse. Otherwise a protective jacketing is required.

    • The specified vapor retarder should have a permeability rating consistent with the environmental conditions and the operating temperature of the system. For cold systems, this must be at least 0.05 perms and for systems operating below 32 degrees fahrenheit, a permeance of less than 0.02 perms should be considered.

    The specified vapor retarder should be user friendly. The insulation contractor will usually install what is specified. If a vapor retarder sheet material is easy to install on pipe insulation, a provision must be made for irregular shapes such as ells, valves and flange covers. A vapor retarder material that’s difficult to install may not be installed correctly. Vapor retarder mastic systems must be a uniform wet or dry thickness per the manufacturer’s specification. Membrane sheet and strip material is dependent upon the complete sealing of the overlapping seams during the life of the insulation system. With the correct insulation specifications, the life of the insulation system and corrosion free pipe and equipment is ultimately in the insulator’s hands. Let’s give them all the help we can.

    4. Frequent inspections

    • The maintenance supervisor and superintendent should be just as familiar with the insulation specifications as the pipe and equipment specifications. The general contractor, maintenance contractor or insulation contractor should provide a copy of the insulation specifications.

    • Inspections should be scheduled weekly.

    • The inspections should be thorough. Inspection under the insulation on a monthly basis should be considered as a mandatory requirement.

    • Inspection should be performed on a daily basis on any re-insulation work. This will confirm that the specifications are followed, that vapor stops are applied properly and that the substrate surface is rust and corrosion free. The contractor will appreciate such close scrutiny, especially if litigation can be avoided through prevention of a massive failure.

    • Finally, look for failure in the obvious places. Any discontinuity in the insulation finish (vapor retarder) such as a wall or tee (branch pipe), ell or flange, is a candidate for failure.
    Figure 1
    Figure 2
    Figure 3
    Figure 4
    Figure 5
    Figure 6
    Figure 7
    Figure 8