Category Archives: Global

For the last 2 to 4 years, many companies have paid more attention to reducing their energy costs. Why? In the face of sharply increasing energy prices, the costs of manufacturing products rise, and global market forces often limit or prohibit passing through these costs to the consumer. The result is lower profit margins.

This is especially true of the chemical and petroleum industries. The plants in these industries are very large and often energy-intensive facilities to operate. Because the chemical industry has always been a purchaser of energy, a significant component of a product’s manufacturing cost is energy expenditure. The petroleum industry is an energy producer, so it was often thought (even by oil-company management) that energy consumption was not an important factor. Once it became apparent that energy costs amount to more than 50 percent of the cost to refine crude oil into its various end products, many oil companies took a much greater interest in energy savings.

Some of these companies—including DuPont, General Electric, Celanese Corporation, Sunoco, Inc., and Marathon Petroleum Company, LLC—have recognized and included insulation-system improvements in their energy-improvement plans. Why? Improving their insulation systems saves millions and often billions of Btus of energy; tens of thousands to millions of dollars annually; and thousands of tons of greenhouse gas emissions like carbon dioxide (CO2) and nitrogen oxide (NOX) compounds.

The best-run chemical or petroleum facilities recognize that insulation is not just specified and installed for energy-management or energy-reduction reasons, though. Piping, tanks, and equipment in chemical and petroleum facilities are insulated for many reasons, including the following:

  • Process control
  • Energy management
  • Condensation control
  • Freeze protection
  • Personnel protection from burns

The factors often overlap. For example, hot-service piping insulated for heat conservation and energy management also can be insulated for process control and to offer protection from burns. Piping insulated for process control also inhibits freeze-up.

This article discusses several cases of progressive companies that recognized the benefit of focusing on insulation improvements and often got more than they hoped for in the process.

Beyond Btus at Chemical Plants

A chemical plant in the Texas Gulf Coast requested an assessment of its steam piping insulation systems and one of its more energy-intensive production units because the company’s management suspected they could save significant energy and money. They were right. The project identified over 4,500 linear feet of piping insulation that needed improvement. The result of the insulation upgrade project yielded more than 90 billion Btus saved and a return on investment (ROI) of more than 160 percent. It is important to note that the ROI was based on an energy cost of only $3.50 per million Btus. Using today’s cost of energy, this would have resulted in an ROI of at least 300 percent.

These results alone would easily justify the improvement. However, that was not the only benefit the plant received. The existing steam piping insulation had extensive damage to the aluminum jacketing—small perforations in the jacket as well as sealant failure scattered along its length—indicating that the extensive rain in the Gulf Coast area was getting into the insulation, ruining its efficiency. Interviews with the powerhouse personnel confirmed that the plant had to increase steam generation by 25 percent just to maintain sufficient pressure in the steam piping during a rainstorm and for a significant time afterward. Once the insulation systems were repaired, however, the rain could not enter the insulation, saved energy kept a significant amount of steam from condensing in the distribution piping, and the powerhouse did not have to add nearly as much generating capacity to keep up with the plant’s steam demand. This made the powerhouse easier to operate and resulted in energy savings.

The steam that was condensing in the main distribution piping was overwhelming the existing steam traps. Before the assessment, plant maintenance personnel thought they had problems with the steam traps and frequently replaced them. The steam traps actually had been overwhelmed by the amount of steam condensate and were working as well as possible to remove all of the excessive condensate from the steam piping. The insulation upgrades and repairs all but eliminated that problem.

The excessive steam condensation caused other problems, too. Production units located farthest from the powerhouse had trouble with steam pressure during rainstorms, even though the powerhouse added steam-generating capacity as fast as it could. For example, a 150-pound-per-square-inch (psi) steam line is normally around 350° to 365°F, but it would fall well below 300°F during a rainstorm and for some time afterward. This meant the production units were not getting the temperatures needed in their heat exchangers, etc., to properly run their facilities and manufacture product. The insulation upgrades significantly improved the steam-pressure loss and made it easier to operate these production units.

The excessive steam-condensate problem in the main distribution piping put a strain on the relationship between the plant owner and some tenant facilities. These tenant production units were sections of the plant that had been sold to other companies in the past due to the sale of certain product lines. These production units were paying for utilities, such as steam, based in part on the amount of direct steam they consumed. However, they also shared the cost of the steam generated in the powerhouse that was lost before it reached any of the production units. This was a high-cost item that the tenant facilities were paying for but not getting any benefit from, and they objected—loudly. Fortunately, the insulation upgrades to the main steam-distribution pipelines significantly reduced steam condensation before it reached the production units, reducing the loss and cost accordingly.

The upgrades to the plant’s steam-system piping and hot-service insulation not only resulted in large cost savings, but it also improved process efficiency and owner-tenant relations.

Petroleum Refinery Speeds Maintenance And Saves Money

A petroleum refinery in the Northeast underwent an insulation assessment that resulted in an insulation upgrade project for one of its major production areas. Like the chemical plant example above, the goal was to save energy and money; and, like the example above, the project succeeded, netting billions of Btus saved and an ROI of more than 100 percent.

Part of the project involved insulating sections of large equipment and piping, heat exchangers, steam turbines, and valves that had never been insulated before. In other cases, significantly damaged insulation was upgraded with new materials. Often these new insulation systems were removable.

A turnaround in an oil refinery is a complex, expensive, comprehensive maintenance procedure involving hundreds of personnel working around the clock to maintain and refurbish equipment they cannot otherwise get to while the refinery is in operation. The goal is to get the maximum amount of work done in the minimum amount of time for the obvious reason that while production is shut down, the refinery cannot make product or money. Once a turnaround is completed, there are often insulation systems that were intentionally removed or otherwise damaged as a result of the turnaround that still need to be repaired or re-installed. This process took up to 6 months in the past and resulted in the unit being unable to get up to full operating capacity during that time.

Unit management noticed something impressive after the next scheduled turnaround, however. With the assessment, the production unit personnel noticed that, because of the use of removable insulation systems, the unit was re-insulated and effectively up to full operating capacity within 2 weeks. Also, fewer personnel were required. The result was a savings of thousands of dollars in turnaround costs and, more importantly, the ability to reach full operating capacity more quickly. For an oil refinery in the current business climate, this is a large savings and an opportunity to make more products available to sell in a “sold-out” market.

Energy Improvements and a Safer Work Climate in One Package

The same Northeast oil refinery mentioned above had another insulation assessment performed to help develop an insulation upgrade project for one of the largest production units on the refinery. Again, the goal was to develop a project that would save a significant amount of energy and, therefore, energy cost.

The resulting project delivered impressive energy savings. Although designed to net considerably more than 240 billion Btus and an ROI of more than 340 percent, the project’s final results were actually better—by around 25 percent. The annual savings to this production unit were well over $1.5 million, and the greenhouse gas reductions of over 19 million pounds of CO2 and 38,000 pounds of NOX were equally impressive.

This project contributed to the safety of the unit’s workplace. More than 150,000 square feet of bare surfaces, with an average operating temperature of 400°F and peak temperatures higher than 700°F, were now insulated and no longer posed burn hazards to personnel. With more hot surfaces insulated, local ambient temperatures in the unit will be lower during summer months, when heat exposure risks—like heat exhaustion and heat stroke—are higher.

The beauty of this successful insulation project is that it resulted in both a large energy-cost savings and an improved safety climate for the production unit.

Equipment Integrity Improvement Project a Big Success

An oil refinery in the Northeast had a problem of corrosion under insulation (CUI) in its water-treatment area. Piping and equipment were corroding in several areas, causing expensive equipment and piping repairs. An insulation assessment was performed to determine where insulation problems might be contributing to the issue.

The operating conditions of this piping and equipment were near ideal for CUI—operating temperatures were around 200° to 250°F, and insulation was applied over uncoated surfaces. The condition of the insulation systems, the materials selected, and, in some cases, the installation methods proved to be the biggest contributors to the CUI problem. Any damage to an insulation system in the unit let rainwater into the insulation system, but there were insufficient operating temperatures to adequately dry it out again. One problem was that a compressible insulation material was installed under aluminum jacketing. All areas where personnel came in contact with insulation would end up deforming the jacketing, breaking the sealant seal, and often cutting the jacketing. This was aggravated in some cases by poor installation of the insulation, incorrect location of the horizontal lap to provide good watershed on horizontal piping, and vertical end-cap construction that diverted water into the insulation instead of shedding it.

A project was developed and executed, using a different, structurally rigid insulation material along with different installation requirements. To help prevent future problems of this size, the refinery strengthened its requirements for under-insulation coatings on carbon steel and 300 series stainless when the operating temperatures are between 200°F and 300°F.

Although the project’s main goal was to improve piping and equipment reliability, it saved energy money, too. The project yielded a savings of over 32 billion Btus and an ROI of around 100 percent—not bad considering the initial goal was to keep equipment from corroding.

All of these successful assessments show that proper installation and maintenance of industrial insulation saves more than just energy. This is especially true in the chemical and petroleum industries, where significant savings and greenhouse gas reductions also result from insulation improvements.
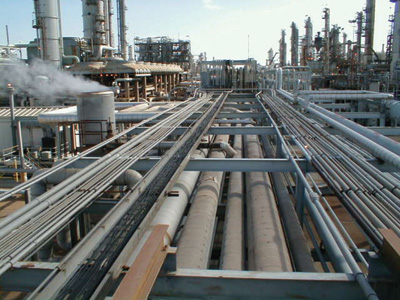
Figure 1

Figure 1: Steam Piping
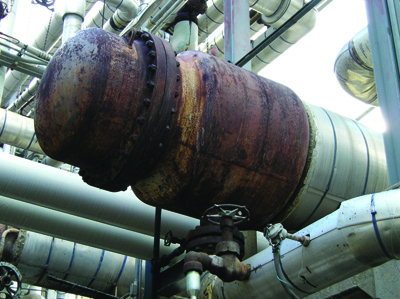
Figure 2

Figure 2: Heat Exchangers

Figure 3

Figure 3: Oil Refinery Production Unit
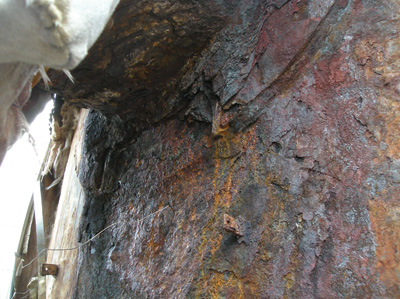
Figure 4

Figure 4: CUI

U.S. Gas Fundamentals

While the United States is the world’s second largest natural gas producer after Russia, it is also the world’s largest natural gas consumer and importer. As of 2004, U.S. natural gas production and consumption stood at approximately 18,500 billion cubic feet (Bcf) and 22,400 Bcf, respectively.

Natural gas constitutes approximately 23 percent of America’s energy consumption. Most gas consumed domestically is produced in the United States or Canada, but these existing supplies are insufficient in the face of growing demand.

North America, and in particular the United States, requires additional sources of energy to meet expected increases in demand over the decades to come. While it is commonly known that the United States has imported the majority of its crude oil for some time, it is a lesser-known fact that U.S. natural gas production has been unable to keep pace with domestic demand and that incremental increases in natural gas imports from Canada are not expected to offset future demand growth.

U.S. imports of liquefied natural gas (LNG) in 2005 were relatively unchanged from 2004 levels, but import totals for 2006 were around 830 Bcf. In 2007, U.S. LNG imports are expected to be more than 1 trillion cubic feet (Tcf).

Prior to 1999, Algeria was almost the sole provider of LNG to the U.S. market. However, freight economics dictated the shift in supply to Trinidad and Tobago when LNG production commenced there. Today, over 70 percent of U.S. LNG imports come from Trinidad and Tobago.

In an effort to diversify sources of LNG supply, U.S. importers now procure product from Nigeria and the Middle East, but the majority of LNG arriving at U.S. terminals continues to originate in Trinidad and Tobago.

Further supply diversification is expected to occur over the next few years. The table below details long-term LNG supply contracts in various states of development with producers in Indonesia, Australia, and Equatorial Guinea. These supplies of LNG are the main sources that constitute the rapid regasification terminal expansion in the United States.

Such market fundamentals, in addition to recent price increases, create a favorable environment for increased imports of LNG, which amounted to 652 Bcf—roughly half the expected future demand—in 2004. However, greater reliance on LNG is stymied by the lack of sufficient capacity at U.S. regasification terminals. There are only five such import terminals currently in operation in the United States, and regulatory hurdles and opposition from both public and private bodies have hindered the construction of additional regasification infrastructure.

The five U.S. import terminals are operating in the following locations:

  • Everett, Massachusetts
  • Cove Point, Maryland
  • Elba Island, Georgia
  • Lake Charles, Louisiana
  • Penuelas, Puerto Rico
Technology for Tomorrow

The LNG market in the United States underwent a fundamental change in August 2005, when President George W. Bush signed the Energy Policy Act. This clarified the federal government’s role in choosing sites and overseeing operation of onshore and near-shore LNG import terminals, and gave the Federal Energy Regulatory Commission (FERC) ultimate authority over states on LNG issues.

By the end of 2005, the FERC had approved 12 LNG terminals, and the U.S. Coast Guard had approved 2. Most of these proposed LNG terminals will be located in the Gulf of Mexico, resulting in relatively little opposition from a region already accustomed to abundant petroleum industry infrastructure. Twenty more facilities are currently proposed. Of these, 12 will be under the authority of the FERC and 8 will be offshore and under the authority of the Coast Guard.

To facilitate the importation and regasification of LNG, there has been a rapid expansion in the range of alternative offshore LNG importation methods. These new methods are expected to compete with conventional onshore regasification terminals.

The following concerns shared by individuals, communities, and governments act as the catalyst for alternative, offshore LNG regasification:

  • Environmental issues. One of the most appealing features of offshore LNG import terminals is their lack of environmental impact on shorelines and population centers. An offshore LNG import terminal is a relatively small and isolated installation; in the unlikely event of an accident, few would be affected.
  • Security and safety issues. The enhanced security and safety of offshore LNG infrastructures is a result of the remoteness of these facilities. Access to offshore LNG sites can be monitored and restricted to a much greater extent than access to onshore installations.
  • Regulatory issues. U.S. offshore LNG facilities are under the jurisdiction of the U.S. Coast Guard—not the FERC. This is positive, because the Coast Guard seems to be both less bureaucratic and more efficient. For example, the U.S. Coast Guard approves LNG project applications in 1 year, while it usually takes the FERC 18 months or more to approve an onshore facility.

Offshore receiving technologies can be defined by the following categories:

  • Offshore gravity-based structures (GBS). A GBS LNG import terminal consists of concrete or steel caissons on the seabed. This type of installation is completely self-supporting with respect to its operation, utilities, and power generation.
  • Platform-based import terminals. These terminals utilize existing oil and gas platform structures, converting them to accommodate LNG deliveries.
  • Floating storage regas units (FSRU). An LNG import terminal concept consists of a purpose-built, permanently moored steel structure with LNG carriers shuttling between an export facility and the import site.
  • Regasification vessels. A standard LNG carrier is modified to enable the vessel to discharge regasified LNG to a subsea pipeline through an internal turret arrangement connected to an offshore mooring buoy.

Each of these offshore regasification technologies has its own merits and disadvantages. Determining which technology to use is highly dependent on various environmental factors, including water depth and other logistical factors.

Expanding Terminals, Expanding Possibilities

On June 15, 2006, the FERC approved a number of filed applications to develop new liquefied natural gas (LNG) import facilities in the United States. These projects included the following three new facilities, plus expansions on two existing U.S. facilities:

  • Creole Trail LNG and Creole Trail Pipeline
  • Port Arthur LNG and Port Arthur Pipeline
  • Crown Landing LNG Project
  • Sabine Pass
  • Dominion Cove

If the facilities above are brought online, they will increase U.S. LNG import capacity to 8.2 billion cubic feet per day (Bcf/d), and eventually to 9.7 Bcf/d.

LNG was once considered too expensive for the American market, but because of rising natural gas prices and falling LNG production and delivery costs, the fuel is an increasingly viable and potentially profitable source of energy for the North American market. However, since U.S. import capacity is currently insufficient to meet projected U.S. forward demand, additional regasification facilities are required to bring additional supplies to market.

The industry has expressed concern that companies active in the market are running the risk of overbuilding import-terminal capacity, creating a potential oversupply in the market that will eventually depress gas prices and impede operating profitability. This concern is compounded by the fact that the combined production capacity of all North American LNG projects currently on the drawing board exceeds 75 Bcf/d of gas. In 2004, the entire global LNG business averaged only 18 Bcf/d. It is therefore inevitable that many import-terminal projects will fall by the wayside, while others will likely be rejected during the permitting process.

Many see the expansion of U.S. LNG imports as a way to lessen U.S. dependence on foreign oil, and they welcome the expansion plans. Still others oppose any new LNG import terminal developments, citing the potential threat posed by terror groups and environmental disruption. These factors contribute to the complexity associated with the billions of investment dollars required to construct new LNG import and regasification facilities.

Evolving LNG market fundamentals, regulatory changes within the U.S. government, and innovative offshore regasification technologies are setting the stage for a promising future for LNG imports into the United States. These imports will play a significant role in helping the United States greater diversify its sources of global energy supply. It is an exciting, though challenging, time in the energy industry. With a growing global LNG market, there are definitely new expansion opportunities for businesses in the United States, and around the world.

This marketplace analysis of the potential for LNG terminals in the United States shows the possible impact LNG will have on the future of the energy industry. New U.S. import-terminal projects could create opportunities for the overall construction marketplace, as well as the mechanical and industrial insulation industry.

Stay tuned for upcoming articles in our March/April State of the Industry issue that cover the opportunities in the overall insulation marketplace. Also, read the upcoming June Insulation Outlook to learn more about insulation’s role in building an LNG system.

This study provides a comprehensive analysis of over 60 LNG facilities in operation or in various stages of planning and development in North America. The review included the following: participant and company contact information; a description of the project and its main features; anticipated operating capacities; expected sources of supply; date or expected date in service; status of regulatory approvals; and breaking project news and recent developments. To learn more about this report, please go online and visit www.utilisenergy.com.

Editor’s note: The opinions and information shared by the author in the preceding article have not been confirmed, nor are they endorsed, by the NIA.

Figure 1

Table 1: Long-term North American LNG supply contracts under development. 2006

Figure 2

Figure 1: LNG Existing LNG Terminals

Figure 3

Figure 2: Existing and Proposed North American LNG Terminals

Figure 4

Table 2: Summary of offshore regas characteristics

Figure 5

Figure 3: Potential North American LNG Terminals

The December 2006 issue of Insulation Outlook featured an article on the new National Museum of the Marine Corps in Quantico, Virginia, a unique structure that incorporates innovative use of audio-visual aids and climate control to give visitors an “immersive” experience that brings history to life. This article explores the green design elements that make the museum not only a lasting monument honoring the brave men and women who have served in the Corps, but a forward-looking structure designed to be environment-friendly into the future.

Background on Building Green

As energy and environmental concerns—from a local to a global scale—grow increasingly prominent in the news, consumers and industry seek ways to conserve energy and preserve the environment. Green building is gaining attention and favor. As a trend with marked effects on the insulation industry, it is clearly worth looking at more closely.

The U.S. Environmental Protection Agency (EPA) describes “green or sustainable building” as “the practice of creating healthier and more resource-efficient models of construction, renovation, operation, maintenance, and demolition.” At a portion of its website dedicated to green building (www.epa.gov/greenbuilding), the agency notes, “Research and experience increasingly demonstrate that when buildings are designed and operated with their total lifecycle impacts in mind, they can provide great environmental, economic, and social benefits.”

According to the EPA, buildings in the United States represent 39 percent of total energy use, 68 percent of total electricity consumption, and 38 percent of carbon dioxide emissions. Add to that figures from the U.S. Green Building Council (USGBC) —which addresses the question “Why Build Green?” on its website (www.usgbc.org) —indicating that U.S. buildings also account for 30 percent of raw materials use and 30 percent of waste output, and the scope of the opportunity for improvement becomes apparent.

In an effort to standardize green building practices, the USGBC developed the Leadership in Energy and Environmental Design (LEED) Green Building Rating System in 2000, and now it is nationally accepted. Assessing performance in critical areas of “human and environmental health, sustainable site development, water savings, energy efficiency, materials selection, and indoor environmental quality,” LEED programs apply to new and existing buildings, commercial and residential projects, and more.

General principles for building green include developing an energy-efficient design; using renewable energy sources (such as daylighting, natural cooling, and passive solar heating); and selecting durable and recycled materials.1

Designing a Museum with the Environment in Mind

Given the growing interest in building green, when the time came to choose an architect for the new National Museum of the Marine Corps, a key element for consideration was responsiveness to energy and environmental needs. The design was open to national competition. Some 30 architects participated in phase one of the competition before the field was whittled to a final four, from which Denver-based Fentress Bradburn Architects, Ltd., was selected. The firm’s entry combined strong, innovative design with energy-conserving and sustainable design approaches.

Fentress Bradburn has a history of sustainable design. In 1993, the company received the Architecture and Energy Award for the Natural Resources Building in Olympia, Washington. Since then, it has won awards for 40 projects that merit distinction in green architecture, including the 2003 LEED Gold 2.0 award for the California Department of Education Headquarters Building. In addition, according to the company’s website, more than 30 percent of its licensed architects are LEED accredited.

Interviewed for this series of articles on the new museum, Charles Cannon, project architect/project manager with Fentress Bradburn, stressed that “Energy efficiency is always a concern of ours.” He added that although the museum is not a LEED-certified building, the project nonetheless incorporates many environment-friendly approaches, including use of the following:

  • Highly recycled materials (such as the steel used in the structural system—see Photo 1)
  • A green roof system
  • Natural daylight (as one approach to reduce long-term operating costs)—with daylighting in the atrium, office, and cafeteria spaces of the building
  • Bioretention facilities to filer site runoff

The gallery section of the museum features a green roof system consistent with the sustainable design concept of earth integration. According to Cannon, this system covers more than three-quarters of the roofing (see Figure 1).

Although not yet as popular in the United States as in Europe, green roof systems have potential to reduce capital and operating costs. Green Roofs for Healthy Cities, a not-for-profit association focused on increasing awareness of the benefits of green roof systems, as well as the market for related products and services, describes potential areas for cost savings at its website (www.greenroofs.net). One such area—where green roof systems offer the same type of benefit as commercial insulation—is in reducing energy costs. According to the organization, “Twenty centimeters (cm), or 7.9 inches, of substrate with a 20- to 40-cm (7.9- to 15.7-inch) layer of thick grass has the combined insulation value of 15 cm (5.9 inches) of mineral wool.” Along with thermal insulation, green roof components such as soil, plants, and air layers offer sound insulating properties as well.

In addition to savings on heating and cooling costs, green roof systems can reduce maintenance and replacement expenses. Green Roofs for Healthy Cities estimates that a green roof (whose membrane is protected) can last up to twice as long as a conventional roof. Green roofs also can reduce or eliminate the need for roof drains, as the substrate and plants absorb a good percentage of precipitation (exact figures depend on the type of materials and plants selected, season, and other factors).

At the National Museum of the Marine Corps, according to Cannon, “the installed [green roof] system is by Henry. From the inside out it is made up of concrete-filled acoustical metal deck on steel structural system, green roof membrane, building rigid insulation, composite drainage material and root stop, filter fabric separation layer, 6 inches of soil mix, and ballast aggregate around the perimeter.” Although some green roofs are designed to support “urban agriculture,” serving as food-producing gardens as well as a roof for the structure, the museum’s green roof is more aesthetically motivated. As a design element, the grass and flowers on the roof match those on the surrounding hills.

In addition to the green roof, earth berms are used at the museum to reduce thermal load variations (see Photo 2).

The Fentress Bradburn website (www.fentressbradburn.com) notes that the green design is expected to yield “20 percent overall energy savings over ASHRAE 90.1-2001, despite high lighting load and 24-7 operation.”

Cannon also described the project’s bioretention facilities, another “green” consideration: “Site runoff is conveyed as sheet flow to the treatment area, which consists of a grass buffer area, sand bed, ponding area, organic or mulch layer, planting soil, and plants. Runoff passes over this system, which slows the runoff velocity and distributes it evenly along the length of the ponding area. Water ponds to a depth of 6 inches and gradually infiltrates the bioretention area. Water then filters though the planting soil, organic soil, and sand layer to the underlying subsurface drainage system, which diverts it back to the storm system. At this point, the site water has been filtered.”

The architectural firm’s website lists the following additional sustainable design features of the museum:

  • Limited, permanent, highly efficient irrigation system (reduces water use)
  • Increased ventilation effectiveness and CO2 monitoring for system performance feedback
  • Water side economizer during cold weather to provide chilled water using cooling tower without chillers
  • Rotary enthalpy heat exchanger to precondition outside air by transferring energy from the exhaust air stream to the entering air stream
  • Low water consumption plumbing fixtures
Public Building Reflects Growing Trend

Energy and environmental issues are in the news these days—from the latest turn in oil prices to the global warming debate. While not always completely informed about the issues, the public is concerned and is voting with its feet, driving hybrid automobiles and participating in recycling efforts. Industry is motivated (as it always has been) to reduce costs. Green building efforts answer these concerns, and the insulation industry will need to participate.

(1)See www.buildinggreen.com for a checklist on building green from Environmental Building News.

Figure 1
Figure 2
Figure 3

Can a green building really be green without consideration of proper mechanical insulation types and thicknesses? Whenever you read an article about Leadership in Energy and Environmental Design® (LEED)–certified or green buildings, you find fascinating information about environmentally friendly construction. Mechanical insulation is seldom mentioned as a potential energy- and pollutant-reduction solution.

Green buildings use 36-percent less energy than conventional buildings use on average, according to a recent study by Washington, D.C.–based energy consultancy Capital E.

In Chicago, One S. Dearborn Street Tower is certified by the U.S. Green Building Council (USGBC). It is expected to use 30-percent less energy than comparably sized buildings. Instead of forcing air down from the 30-foot ceiling in the lobby, heat rises from the floor. The building also uses variable-speed fans on the air-conditioning systems, according to an article in Crain’s Chicago Business.

Some green buildings will have a space between the interior and exterior walls. The lighting in many buildings is being adjusted to reduce energy consumption. Locally friendly plant materials that use less water have been instituted in the landscaping. In many buildings, a portion of the roof is covered with small plants and trees. In Chicago, more than 60 green roofs were installed or planned in 2005 through city initiatives. And, of course, recycling of construction materials helps these buildings comply with the scope of green buildings.

In most articles pertaining to green buildings, mechanical insulation is not even mentioned. In a recent energy symposium in Chicago, a panel of experts on energy audits was asked if they look at mechanical insulation for energy payback and reduction. Not one member of the panel ever considered insulation as a source of energy reduction.

Insulation professionals know that the first thing in many buildings to be omitted or reduced is the mechanical insulation. Perhaps this is because everyone assumes that insulation is already included in the building specifications. The proper thickness of insulation on all mechanical services will reduce energy consumption and allow for a more-efficient building. It doesn’t cost—it pays. When engineers, architects, general contractors, or mechanical contractors ask for “value engineering” from insulation contractors, they are asking for the elimination or reduction of insulation on services. We should be very clear here: Mechanical insulation is the only item in the building that begins to pay for itself as soon as it is installed.

As an example of the possible savings in energy and greenhouse gas emissions, use a 2-inch, hot-water heating pipe supplying 180-degree hot water to the coil system in a normal commercial building. Calculate the data using 2-inch-thick fiber glass with all service jacket (ASJ) as the insulation of choice. The time of operation is 6 months or 4,160 hours. If the data is prepared using the North American Insulation Manufacturers Association (NAIMA) 3E Plus® program, the bare, uninsulated, pipe operating at 180°F for 6 months loses about 610,700 British thermal units (Btus) per year. The same pipe with 2 inches of fiber glass insulation will lose about 53,850 Btus per year for a 91-percent efficiency rating. This reduction in energy use also extrapolates into savings of greenhouse gas emissions. The same 2-inch pipe operating at 180°F for 6 months will go from 94.9 pounds of carbon dioxide (CO2) per foot per year to 8.4 pounds per foot per year. The same reductions take place for nitrogen oxide (NOX), which goes from .19 pounds per foot per year to .017, and cerium (Ce), which goes from 25.86 pounds per foot per year to 2.28.

If a building is going to wear the green label, mechanical insulation must be a primary consideration in its design and construction.

In 1927, when William Randolph Hearst commissioned the six-story building in Midtown Manhattan that would house the offices of the Hearst Corporation (which at the time was made up of 12 magazines), he envisioned a much larger company in future years. That may be why the L-shaped building, originally 40,000 square feet, was structurally reinforced from the beginning to support an office tower that would reinvent the New York City skyline. Over time, however, the International Magazine Building, located at 959 Eighth Avenue between 56th and 57th Streets, remained largely the same; it was even designated a Landmark Site by the Landmarks Preservation Commission in 1988. Then, last year, a new era began for the Hearst Corporation.

On October 9, 2006, the 46-story, 856,000-square-foot Hearst Tower was opened—indeed an extraordinary addition to the New York City skyline. Just a few weeks earlier, on September 22, 2006, the tower received its official green status from the U.S. Green Building Council (USGBC). It was LEED (Leadership in Energy and Environmental Design) certified at the Gold level, an amazing accomplishment for a New York skyscraper and a standard-setter for big-city businesses to come. The building is designed to use 26-percent less energy overall than the minimum requirements for the city of New York. (See Figure 1 for details on LEED certification requirements.)

There is an undeniable emphasis throughout the Hearst Tower on both natural light and fresh air. This ultramodern take on the workplace allows employees to collaborate in an environment that is both open and beautiful. The focus on providing a healthy space with the highest environmental quality in every aspect of the building’s design makes the tower a new standard in workplace design. The Hearst Corporation is as diverse as its facilities. Its major interests include magazine, newspaper, and business publishing; ownership in leading cable networks; TV and radio broadcasting; Internet businesses; TV production; newspaper features distribution; and real estate. Modern technologies enhance the company’s ability to perform. In addition to magazine and corporate offices, the tower houses a broadcast studio, a digital photography center, a fitness center that is open to employees at subsidized prices, a corporate café, a 168-seat theater, exhibition spaces, and a Good Housekeeping Research Institute. Energy Star appliances in these facilities add to the building’s cumulative energy savings.

The company hired Lord Norman Foster, Hon. Fellow of the American Institute of Architects (FAIA), of Foster and Partners in the United Kingdom, as the architect for the tower. Lord Foster is both an AIA Gold Medal recipient and a winner of the Pritzker Architecture Prize. Foster and Partners worked with Gensler, an award-winning firm cited by the AIA as a model for the design professions in the 21st century, to implement the sustainable design of the tower.

Green From the Ground Up

The tower’s design is unique in that it preserves the integrity of the International Magazine Building while adding an entirely new, vertical, glass-and-steel dimension that rises magnificently 597 feet from the original base. The façade of the 1928 building now wraps around as a pediment for the new tower. A transparent skirt of glass separates the old below from the new above, giving visitors the impression that they are looking up at a glass tower floating in the air above them.

The frame of the tower is triangulated in a “diagrid” design to emphasize the building’s vertical proportions (see Photo 1). The exterior is a series of four-story, peeled-back steel triangles with a glass façade from floor to ceiling. This unusual design required 20 percent less steel than would a conventional tower of the same size. The diagrid frame actually saved about 2,000 tons of steel, and over 90 percent of the structural steel used in the tower contains recycled material.

The glass around the exterior of the building has a special low-emissivity (low-E) coating that allows natural light to flood the building while blocking the invisible solar radiation that causes heat. This low-E coating is a microscopically thin, clear metal or metallic oxide layer deposited directly onto the surface of the glass panes to create a more “insulated” glass. The coating reduces the rate at which a window conducts nonsolar heat—the window’s U-factor—which helps control heat transfer and therefore reduces long-term energy costs. Windows with low-E coatings typically cost about 10 to 15 percent more than regular windows, but they reduce energy loss by as much as 30 to 50 percent.

Other key “green” aspects of the Hearst Tower include its unique approaches to heating and air conditioning. The floor in the atrium is paved with limestone that is heat conductive. Polyethylene tubing embedded underneath the floor is filled with circulating water for cooling in the summer and heating in the winter. According to Andrew J. Thomann of Turner Construction Company, the ceiling tile in the Hearst Tower contains 27-percent recycled content. The tile backing was foil faced, so as not to add any particulate matter to the ventilation stream. The floors throughout the tower also were manufactured with recycled content. Concrete surfaces were finished with low-toxicity sealants.

A two-story water sculpture in the atrium, called Icefall, was created from thousands of glass panels that make a waterfall. The water for the falls is actually rainwater collected from the roof and then chilled. Besides being a beautiful focal point for employees and visitors, Icefall keeps the atrium cool in summer and humidifies the area in the winter. Icefall is complimented by a 40- by 70-foot mural created by artist Richard Long from the mud of the Avon and Hudson rivers. The mural “Riverlines” celebrates rivers of flowing water as a critical environmental element (see Photo 2). Escalators run between the falls, from the street level to the internal plaza and mezzanine areas, which are used for meetings, exhibitions, and special functions.

Collected rainwater adds to the building’s sustainability. It flows from the rooftop to a 14,000-gallon reclamation tank in the basement. It is then used to replace water that has evaporated from the office air-conditioning system. The rainwater also feeds into the pumping system used to irrigate the property’s plants and trees.

Because of its energy-saving qualities, insulation is an inherently green product. It is also a critical soundproofing feature for a building that hosts some 2,000 employees on a daily basis. According to Thomann, the fiber glass insulation used in the Hearst Tower was made of an average of 30-percent postconsumer recycled glass and 5-percent postindustrial recycled glass. Mineral-wool insulation used in the building had a minimum of 75-percent postindustrial recycled content. Batt, blanket, blown, and sprayed insulations were not installed above hung ceilings or in return air plenums so as not to add particulate matter to the ventilation air stream. Duct-liner products were faced so that particulates would not enter the ventilation air stream.

According to Hearst’s website, www.hearstcorp.com, at the opening of the Hearst Tower, Lord Foster said, “The completion of Hearst Tower is a defining moment for New York. It represents great optimism and a sign of more good things to come after the trauma of the city’s recent history. I am grateful to have been given the opportunity to work on the realization of this dream originally envisioned in 1926. It is a mark of a determined client and a great city that this tower literally sparkles on the New York skyline today.”

The Hearst Corporation has taken a major step toward tomorrow by investing in the Hearst Tower. The attention to sustainable design will no doubt pay untold rewards for years to come. This building is groundbreaking in more ways than one, and it is reinventing more than just the New York City skyline.

What if there were a way for the public and private sectors to meet in the middle, equally contribute to project funding, and agree on flexible building standards, creating lasting change—for the better—in the U.S. commercial building industry? Does that seem about as likely as, say, achieving world peace? Think again. The National Institute of Building Sciences (NIBS), established by the U.S. Congress in 1974 as a liaison between government agencies and private industry, fosters just that sort of successful collaboration.

According to www.nibs.org, the mission of NIBS is to accomplish the following:

  • Improve the building regulatory environment
  • Facilitate the introduction of new and existing products and technology into the building process
  • Disseminate nationally recognized technical and regulatory information

In both public and private facility design, there has long been a lack of standard specifications for every aspect of the building process. NIBS recognized this need and developed a unique, collaborative way to address it. The institute is taking the lead in bringing together representatives from government agencies and private industry—from the most knowledgeable groups in each segment of the building process—to create a Web-based Whole Building Design Guide (WBDG). The guide, available at www.wbdg.com, focuses on providing specifications that anyone—from the newest entry-level employee to the seasoned professional—can turn to for guidance. It is an ambitious project, grown from the realization that there is a pressing need for an authoritative resource on building sciences and the latest technologies. The goal is for the WBDG to become the primary communication vehicle for building-design professionals. The guide is both supported and maintained by NIBS.

The WBDG covers a broad range of topics, but as yet there is no significant information included in it that specifically relates to mechanical insulation. While there are several sources for mechanical insulation specifications, none combines all of the best knowledge in one easy-to-access place. Therefore, NIBS formed the National Mechanical Insulation Committee (NMIC) For Building and Industrial Applications to focus on compiling and approving a Mechanical Insulation Design Guide (MIDG), which will be part of the WBDG. This information will appear as a link on the WBDG website. With one click, end users will be able to access the most important information to aid in decision making for mechanical insulation.

“There’s a lot of information on mechanical insulation available, but it’s dispersed in handbooks and documents that aren’t readily available. The committee felt it would be useful to develop a process to take information that has been reviewed by a number of people and organizations in the industry and agreed upon on a consensus basis, and put it up on this website,” explains Chris Crall, P.E., an industry consultant to the NMIC and a mechanical engineer.

To develop the MIDG, the NMIC is working with the National Insulation Association (NIA); the American Society of Heating, Refrigerating, and Air-Conditioning Engineers, Inc. (ASHRAE); ARCOM (Masterspec®); the Midwest Insulation Contractors Association (MICA); and Process Industry Practices (PIP). Each of these organizations has valuable technical information available in various forms. The design guide will compile information available from each group and present it to end users as a single reference point for mechanical insulation specifications. The NMIC’s objective is to complete the guide and make it available online by the end of the first quarter 2007.

“It’s envisioned to be a dynamic resource tool,” says Crall. “Information will be added on a relatively frequent basis as the NMIC sees the need.”

h5>A Novel Approach

The NMIC’s “Proposed Approach for Development of a Mechanical Insulation Design Guide” notes that the MIDG will contain links to a variety of websites for organizations and resources, including the following:

  • Technical and standards organizations, such as ASHRAE and the American Society for Testing and Materials (ASTM)
  • Insulation industry associations, such as NIA, the North American Insulation Manufacturers Association (NAIMA),and MICA
  • Other supporting organizations, such as PIP
  • WBDG ProductGuide
  • Material suppliers
  • Reference materials

The MIDG will include important information and even more valuable online tools. Many building designers are unaware of the various insulation products on the market. For example, currently there is no one place that refers them to different manufacturers’ websites and product information. The MIDG will allow manufacturers to post submittal sheets for their products. Once approved by the NMIC, a link to the manufacturer’s site will be posted online.

Other useful tools that will be part of the MIDG include the following:

  • A link to the Insulation Materials Specification Guide from the National Insulation Training Program (NITP)
  • A link to information on the 3E Plus® insulation software program
  • Simple calculators that explain the necessary computations for mechanical insulation design and allow end users to perform those calculations online (for example, how to calculate time to freezing, temperature drop with flow down a pipe or duct, or first order estimates for insulation thickness for a given surface temperature)

“This will be a great design guide that provides useful tools, especially for new people coming into the industry,” says Kartik Patel, NIA Technical Information Committee representative. “It will condense a lot of information in one place, making it easily accessible to end users. And the documents on which the MIDG is based are very well accepted within the industry.”

Making It Work for End Users

The MIDG will be flexible enough to allow for the different design options available, as well as the myriad products and materials that can be used in any mechanical insulation system. There will be four major sections in the MIDG, based on the four main headings in Chapter 26 of the current ASHRAE Handbook, titled “Insulation for Mechanical Systems.” The four MIDG sections are as follows:

  1. Design Considerations
  2. Materials and Systems
  3. Installation
  4. Design Data

According to the “Proposed Approach for Development of a Mechanical Insulation Design Guide” document from NMIC:

These four sections contain a good summary of existing information about mechanical insulation, and they also provide a convenient way to organize the additional efforts required for the MIDG. It is understood that different individual and organizational contributors will have expertise in each of these areas. For example, it is envisioned that insulation and accessory material suppliers will contribute significantly to the Materials and Systems section while insulation contractors will be primary contributors to the Installation section.

See “Simplified Overview of Integration by Major Sections” below.

To develop each of these major sections on a consensus basis within the MIDG, the NMIC determined the following five-step process to ensure the accuracy and consistency of the information included:

  1. Establish a team. Four or five reviewers with expertise in the subject matter for each area will form a team. Team members will be recruited from the NMIC and other supporting organizations (such as NIA, MICA, or ARCOM) and preferably would be people who were not involved with the development of the original source document. They will, however, demonstrate that they have the appropriate experience to contribute to the task.
  2. Perform an initial review. The original document will be circulated among each section’s team members, who will review the material, make comments, and suggest additional information to be included in the MIDG.
  3. Rewrite the material. This process merges the existing text with new data, based on the comments and suggestions from the initial review step.
  4. Complete a final review of the material. The rewritten text will be circulated to the entire NMIC for final review. This will be the last opportunity to make comments and suggestions to improve the section’s content.
  5. Finalize each section. All input will be considered, each section will be finalized, and the completed sections will be posted on the WBDG website.

Each section of the MIDG will require a specific approach, based on the necessary individual subtasks needed to complete the section. For example, in Design Considerations, information from NIA’s NITP will be reviewed and possibly integrated into the section. The topic of sustainability also will be addressed, and the Leadership Energy and Environment Design (LEED) Green Building Rating System and other similar initiatives will be covered to give insulation end users a broad range of valuable information.

Working Together To Achieve Success

The development of the MIDG is a unique initiative. It is funded 50 percent by government agencies and 50 percent by private industry (NIA’s Foundation for Education, Training, and Industry Advancement). NIBS works with such key government agencies as the Army Corps of Engineers (COE), the Federal Energy Management Program (FEMP), and the General Services Administration (GSA). This extensive cooperation between government agencies and private industry is a major victory. The U.S. government has a huge stake in NIBS’ efforts—it’s the largest employer in the United States and the biggest user of building space.

The creation of a consistent design guide is beneficial to everyone involved, in both the public and private sectors. This mutually beneficial “meeting of the minds” is an especially important offering to mechanical insulation end users who need an
easy-to-access, single reference point for all their building-design needs. The WBDG is a successful collaboration that provides this much-needed resource, making it a true win-win situation and a coup for the commercial building industry as a whole.

Figure 1

The Alliance to Save Energy (ASE) is a Washington, D.C.–based nonprofit organization dedicated to promoting energy efficiency worldwide. Its move into a new office space in June 2006 was the culmination of nearly a year of planning and execution by the design team.

Prior to the move, the ASE had occupied a small part of a multistory office building since the mid-1990s, but as the staff grew, the ASE was unable to obtain more contiguous space in that office building. ASE management decided to secure a new tenant office space that could be built out as a showcase for building energy efficiency and sustainable design. The ASE used the United States Green Building Council (USGBC) Leadership in Energy and Environmental Design (LEED) Green Building Rating System as a guide, with a goal of obtaining LEED Silver certification.

The LEED Process

Over the past few years, the LEED rating system has emerged as the recognized standard for the design, construction, and operation of high-performance green buildings. The LEED rating system consists of a set of prerequisites and specific sustainable criteria with respective point values. A project registered with the USGBC may be awarded a rating of Certified, Silver, Gold, or Platinum, depending on the number of points earned. The points are obtained in the following general categories:

  • Sustainable site selection
  • Water savings
  • Energy efficiency
  • Materials and resources
  • Indoor environmental quality

Types of LEED Facilities. USGBC began with a LEED rating system for new construction (LEED-NC) in 2000. Since then, the USGBC has created rating systems for existing buildings (LEED-EB), commercial interiors (LEED-CI), core and shell structures (LEED-CS), along with the newly released programs for homes (LEED-H) and neighborhood developments (LEED-ND). Reference guides are available for each of these systems. These guides represent the best practices for sustainability as developed by leaders in the building industry. Under development are rating systems for schools, health care, new construction retail, and retail commercial interiors.

Why Bother?

Why should building owners, occupants, designers, or contractors care about green buildings—and the LEED rating system, in particular? There are many reasons, and the motivating factors vary depending on your point of reference. Businesses benefit from improved worker satisfaction and productivity, as LEED buildings and spaces incorporate features that enhance occupant comfort and health. Building owners benefit in the following ways:

  • Experiencing lower energy and water costs
  • Enhancing the asset value of the building
  • Obtaining a visible and marketable symbol of social and environmental stewardship

LEED-level standards are being adopted by government agencies at all levels. Federal government organizations (which account for over 10 percent of construction in the United States) are adopting or encouraging the LEED rating system. These groups are led by the General Services Administration (GSA), which requires that all building projects meet LEED Certified level standards. Many local governments (such as those in Chicago, Los Angeles, San Francisco, and Washington, D.C.) require all new construction projects to use the LEED rating system. Other countries, such as Canada and India, have created similar rating systems for their own use.

Many universities and colleges across the country are adopting LEED as standard practice for new construction, as are several Fortune 500 companies like DuPont and Bank of America.

Green building design, sustainability, and LEED are key topics for architects throughout the country. (To see an example, visit the American Institute of Architects website at www.aia.org.) Green building design is quickly moving from what is perceived as the risky “cutting edge” to the mainstream. Building engineers and contractors need to become conversant and experienced in these areas to remain competitive.

The LEED programs for new construction and existing buildings are also applicable to industrial facilities. Of particular interest to the insulation industry is a LEED methodology for accounting for Combined Heat & Power installations in new construction projects.

The ASE’s Experience

Getting started. LEED-CI was developed for organizations that, like the ASE, seek to incorporate green building principles and features into tenant spaces. A successful LEED-CI project, like any other green building project, requires incorporating green strategies from the very beginning of the planning and design process. One of the first lessons the ASE learned is that LEED involves much more than just energy efficiency. Energy is but one component of a sustainable building.

The ASE began the process by selecting the site for its new office space, looking to remain in a downtown Washington, D.C., location convenient to the D.C. Metro (subway) system. Fortunately, the downtown area contains a variety of existing office buildings with ready access to public transportation. This allowed the ASE management team to shop around for the best available space within its modest nonprofit budget.

The documentation requirements for obtaining LEED certification can be quite daunting to the uninitiated. USGBC provides a template “scorecard” (in spreadsheet form) for projects registered with USGBC. This template is a valuable aid in tracking the potential credits for a project. Each credit sought must be fully documented, however. Having a project team experienced in green buildings and the LEED certification process is practically essential to navigate the LEED criteria and submittal requirements.

The ASE sought out an architectural firm with LEED Accredited Professionals on staff. It also selected a construction management firm that not only has LEED experience, but also has staff who are active in the local chapter of USGBC. Building commissioning is an integral part of the LEED process, so the ASE hired a commissioning agent with a substantial LEED commissioning background. Having this experienced project team certainly made the design, implementation, and documentation process substantially easier than it otherwise may have been.

Many of the products featured in the new space were donated or provided at a discount by various ASE Alliance Associates—businesses that have formed strategic partnerships with the ASE to promote energy efficiency. Since the ASE has a smaller budget, they could not have afforded to include all of these products without their generosity. However, the large number of contributors did make the documentation process more cumbersome.

Design Features. As a tenant moving into an existing office building, the ASE was unable to make any modifications to the building envelope, which is where the majority of the insulation points would have been assessed. Points for mechanical insulation are counted as part of the entire building envelope assessment. The ASE did make use of acoustical batt insulation to enhance soundproofing between walls in certain areas of the office. The changes to the HVAC system were limited to air-distribution modifications necessary to accommodate the reconfigurations within the space. Therefore, the energy efficiency features of the new space include primarily the ASE’s state-of-the-art lighting system (T-5 lamps, dimmable electronic ballasts, sensors, and advanced technology controls), and Energy Star–qualified office equipment and appliances.

The ASE is not a large consumer of water, but the group reduced water use by installing low-flow aerators on its faucets and placing instantaneous water heaters at its sinks. This has the double benefit of cutting energy use—eliminating the need to heat water in a large tank on a 24-7 basis—and reducing the amount of water people waste waiting for hot water to be delivered through hot-water piping to points of use.

An important component of the LEED criteria is the emphasis on recycling and materials reuse. Developing a program for recycling daily wastes of paper, cans, and bottles is a prerequisite for LEED certification. LEED goes well beyond this, though. The ASE received credit for diverting more than 50 percent of the construction waste from a landfill. This was no small task. The general contractor had to isolate the waste as it was generated to allow proper recycling and reuse. From the ASE’s 18,000 square feet of space, the following amounts of materials were recycled:

  • Four tons of wire
  • Eight tons of ceiling tile
  • Over three tons of carpet
  • Twelve tons of scrap metal

The space is just a bit less than one floor of a 12-story office building. Imagine the potential recycling opportunities in a complete building or manufacturing facility renovation. The ASE’s general contractor documented all of these recycling efforts, as required for credit under the LEED process.

Another aspect of materials reuse is keeping furniture from the previous office and using items left by the previous tenant of the new space. This accounts for over 90 percent of the furniture now used by the ASE. The only new furniture purchased was a limited amount of systems furniture, which has a “Greenguard” Indoor Air Quality (IAQ)–certified product label certifying recycled content and use of low-volatile organic compound (VOC) emitting adhesives.

The renovation required the purchase of many new construction materials, but when feasible the ASE installed materials with significant amounts of recycled content. Below are some examples.

  • The ceiling tile is 43-percent preconsumer recycled content.
  • The carpet has 19-percent preconsumer and 20-percent postconsumer recycled content, and is green label certified by the Carpet and Rug Institute.
  • The floor tile has 35-percent preconsumer recycled content.
  • The office kitchen cabinets are wheatboard, containing 40-percent preconsumer recycled content.
  • The sheetrock contains 28-percent preconsumer recycled content.
  • The steel studs contain nearly 25-percent postconsumer recycled content.

LEED also encourages the use of regionally manufactured materials, whenever possible, to reduce the energy and environmental impacts of transporting materials over long distances. The ASE’s project team located regional sources for the carpet, ceiling tile and grid, sheetrock, steel studs, and doors.

The indoor environmental quality components of the new office space include the use of low-VOC materials for all flooring (carpet and vinyl), paints, stains, adhesives, and sealants (needed for carpet, vinyl flooring, and baseboards).

Lessons Learned

The process of creating a green tenant space buildout was a positive learning experience for the ASE. It provided the group a dose of reality and perspective when advocating building energy efficiency and sustainable buildings. The following are some of the lessons learned in the process.

  • Close coordination with the architects early in the design process is critical. The preliminary design turned out to be far above budget, causing delays as a “value engineering” redesign ensued. Lost in the redesign were some of the HVAC zoning and control functionality, “green” hardwood flooring, and some other desired features.
  • Close coordination among the project team is also important. The team consisted of the architects, general contractor, subcontractors, landlord, and the ASE. Coordination was well managed by the general contractor, but the extent of the ASE’s involvement was more than had been anticipated going into the project.
  • Buy-in from the landlord is essential for a LEED commercial interior project. Landlord support and understanding of the LEED program and process is critical, even during negotiation of the lease. The landlord’s concurrence is necessary on everything from building policies to operations.
  • The geometry of the space affects the ability to receive credits for daylighting. While the new space incorporates glass wall panels on office walls and doors to allow daylight into interior hallways, the overall floor plan and the largely northern exposure are less than optimal for daylighting credits under the LEED criteria. (Nonetheless, the dimmable ballasts and daylight sensors allow the lighting in each office to be reduced depending on the daylight available, further reducing energy use.)
  • Material lead times need special consideration in a LEED project. For example, new doors constructed of wood certified as being from a properly managed forest were not readily available and were deleted from the final project. The fixtures became a critical path item affecting move-in.

The ASE is a nonprofit organization that was able to improve commercial office space to achieve the LEED Silver certification under fairly rigid circumstances. Imagine the changes possible when an organization has more flexible parameters and a larger facility. For a virtual tour of the ASE’s new office space, please visit www.ase.org/officetour.

Your company can now take full advantage of the Department of Energy’s (DOE’s) 2007 Save Energy Now (SEN) program. The application phase for Round 2 of the SEN program opened on October 2, 2006, and will remain open until January 19, 2007, or until the goal of 250 assessments is reached. Don’t miss out on this money-saving opportunity to discover valuable ways to save energy in your facility.

According to the SEN website (www.eere.energy.gov/industry/saveenergynow), SEN is part of a national campaign called “Easy Ways To Save Energy,” which educates the public about simple but effective energy choices, helps U.S. industry and the government reduce their energy use, and supports national goals for energy security. A critical part of the SEN program is its focus on energy-intensive manufacturing facilities in the United States. SEN chooses 250 of these companies each year and sends energy experts to their facilities to conduct free Energy Savings Assessments (ESAs). The ESAs reveal energy- and money-saving opportunities that can be taken in the short, medium, and long terms. (See “Energy Assessments Illuminate Potential for Mechanical Insulation” in the December 2006 issue of Insulation Outlook for more details.)

New features of Round 2 of the SEN program include the following:

  • A broader scope of eligible plant systems, including fan, compressed air, and pumping systems, as well as process heating and steam
  • Cost-sharing opportunities
  • Third-party financing options
  • Use of the Quick Plant Energy Profiler software tool to determine a plant’s overall energy use prior to the ESA

You can participate in the 2007 SEN program in the following simple ways:

  • Apply online for an ESA, which will take place in 2007 if your plant is selected
  • Partner with the DOE’s Industrial Technologies Program (ITP) by cosponsoring assessments, events, and training; linking to the SEN website; and increasing energy efficiency and cost savings awareness within your plant or with your customers
  • Use the tools and resources ITP provides to improve your plant’s energy efficiency and bottom line

For more information or to apply for the SEN program, please visit the Save Energy Now website (www.eere.energy.gov/industry/saveenergynow) or call 877-337-3463.

Imagine a building designed not only to shelter people and materials but to give visitors realistic exposure to locations and events they likely will never experience firsthand, “immersing” them in a range of physical and emotional landscapes so affecting that they lose track of their true environment. Now imagine that the same building is designed and constructed to be forward-looking, incorporating innovative sustainable design features that clearly place it in the realm of the future even as it honors the past. The brand-new National Museum of the Marine Corps—dedicated November 10, 2006, and opened to the public on November 13—is such a building. This article, the first in a two-part series on the new museum, discusses elements of the design that create the immersive experience for visitors. The second article will explore the building’s green design features.

Located on 135 acres adjacent to the U.S. Marine Corps Base at Quantico, Virginia (about 35 miles south of Washington, D.C.), the museum’s mission is to “explore the values, mission, and culture of the Marine Corps through state-of-the art exhibits, world-class contemporary architecture, and compelling subject matter,” according to the Marine Corps Heritage Foundation.(1) Denver-based architectural firm Fentress Bradburn Architects, Ltd., won a national competition to design the museum, developing a unique building that meets the Foundation’s goal. Under one roof, visitors experience exhibits that lead them through boot camp, World War II, the Korean War, and the Vietnam War. In the latter two exhibits, the galleries are actually climate controlled to make the visitors’ experience that much more realistic. Even the museum’s restaurant is vintage Marines—a re-creation of Tun Tavern, known as the birthplace of the Marines.

While the end result is spectacular, designing and constructing a building of “world-class contemporary architecture” capable of supporting significant differences in climate from one exhibit to the next (both in terms of temperature and humidity), while meeting goals of sustainable design to conserve energy and reduce long-term operating costs, certainly presents challenges.

A Building With a Strong Identity

Even before visitors get inside the museum, they can feel strength emanating from the museum’s bold, dramatic appearance. The building’s exterior resonates strongly with the Marine identity. Primary building materials—cast-in-place concrete, metal, and glass—were selected by the architects to represent the Marine Corps’ values of honor, courage, and valor. The most striking feature is a 210-foot tilted mast that rises from the building’s 160-foot glass atrium roof. Rising at a 60-degree angle and clearly visible to all who drive on nearby Interstate 95, the mast is intended to evoke the image of the Marines raising the flag at Iwo Jima during World War II, captured in the famous photo by Joe Rosenthal. The appearance of the atrium and spire also draws comparisons to bayonets or swords raised, the angle of a jet on takeoff, and Howitzer cannons.

Designing an Immersion Experience

To develop a feel for what it is like to be a Marine, members of the design team (some from Fentress Bradburn and others from Christopher Chadbourne and Associates, a Boston-based exhibit design firm) first immersed themselves, visiting sites of historic battles, sleeping in troops’ quarters, and participating in a week’s worth of boot camp in San Diego at the Marine Corps Recruit Depot. The result is a design that incorporates a 35,000-square-foot entrance area at the center of a ring of galleries. An additional 85,000 square feet of exhibits incorporate historical artifacts, multimedia presentations, and immersive sets to give visitors an understanding of Marine culture as well as exposure to Marines’ role and experiences in various conflicts making up the Corps’ proud 231-year history. Figure 1 provides a look at the museum’s floor plan. The central Leatherneck Gallery is some 45 feet tall to accommodate suspended Marine aircraft and additional large artifacts. The gallery’s stone walls, engraved with moving quotations, feature eight enormous (12- x 9-foot) photos of individual Marines. The terrazzo floor gives one the impression of sea, especially dramatic under the huge, skylit ceiling.

While the Leatherneck Gallery and other areas of the museum rely primarily on visual and auditory cues—such as the boot-camp experience where, among other activities, visitors can fire laser M-16 rifles—the most immersive galleries are those that also use temperature and humidity to affect visitors.

The Korean Chosin Reservoir exhibit is set at 58°F (see Photo 2), not as cold as the actual winter conditions (about -20°F) some 250 Marines encountered as they defended the Toktong Pass supply route from Chinese soldiers for 5 days in 1950. Museum visitors will feel the drop in temperature clearly as they pass through glass doors into the exhibit. That feeling, combined with the sight of simulated flares and the outlines of Chinese soldiers’ bodies in the snow, along with the sounds of shouting Marines, will help transport visitors to the harsh battlefield environment where half of the Marines in Fox Company lost their lives.

The physical setting of the Chosin Reservoir exhibit is in stark contrast to the 88°F, high-humidity environment visitors feel in the exhibit on the 1968 siege of Khe Sanh, where conditions approximate the jungles of Vietnam. The exhibit is designed to bring visitors into a critical supply and medevac mission at Hill 881-South. Visitors enter the exhibit through a CH-46 Sea Knight helicopter. As their bodies register the heat and humidity, they take in the sound of bullets hitting the metal fuselage, accompanied by shouting. Once off the helicopter, they see the life-size image of a dead Marine being tended to by a chaplain.

While the interior immersion galleries and the external design elements are moving and reflective of the Marine Corps experience and ethos, they are not particularly straightforward in terms of construction and insulation considerations.

Practical Factors in Execution Including Insulation Solutions

How are the environments maintained within the individual galleries? Charles Cannon, project architect with Fentress Bradburn, notes, “The different atmospheres are created and controlled by the mechanical system. Individual VAV (variable air volume) boxes are used to create the unique climates of the immersion galleries.” He adds that supporting the mechanical system, different types of insulation are used depending on location in the building. For below-grade interior surfaces of the immersion galleries (Type 1), the specifications called for extruded preformed cellular polystyrene insulation conforming to ASTM C 578. Elsewhere, the insulation specified was aluminum foil–faced rigid cellular polyisocyanurate, to conform to ASTM C 1289 (Type 2). Vapor permeance was set at not more than 1.1 perms for the Type 1 areas, and not more than 1.03 for Type 2 areas. Compression resistance of rigid cellular plastics was specified as not less than 15 pounds per square inch (psi) for Type 1 areas, and not less than 25 psi for Type 2 areas.

At the same time that the immersive exhibits incorporate distinct climates, the overall museum environment must be maintained at RH 50 percent to ensure preservation of the historic artifacts on display. Cannon stresses, “As this building is a museum with many priceless and one-of-a-kind artifacts, the focus was preservation.” More than 60,000 artifacts are maintained by the Marine Corps’ History and Museums Division. Of these, 5 to 10 percent will rotate on display at the museum. The artifacts range from an original flag raised on Iwo Jima to letters from Marines out in the field, as well as equipment such as a helicopter, vintage airplanes, and a M4A3 Sherman tank.

Cannon noted that overall thermal resistance is R10 for all applications. In terms of fire-protection requirements, the flame spread index is 75 or less; the smoke developed index is 450 or less throughout.

The atrium roof uses roughly two-thirds of an acre of glass in a skylight design unusual for the top of a low-rise building. Air-circulation studies were assessed how best to manage the volume of air in a space that would be difficult to heat and cool economically. To accommodate the high temperatures of summer, the design calls for a fan with controlled louvers to allow ventilation through the top of the mast. The equivalent of a 20-story building, the 210-foot mast is covered with stainless steel cladding.

The use of natural daylight is one approach to reducing the building’s long-term operating costs. According to Cannon, “Energy efficiency is always a concern of ours.” He adds that although the museum is not a LEED-certified building, the project incorporates many environment-friendly approaches, including the use of highly recycled materials such as the steel used in the structural system. (The museum’s sustainable design elements will be described in more detail in the second article in this series.)

Planning for the Future

The current exhibits—along with the adjacent Semper Fidelis Memorial Park—represent the first phase of the project. Future exhibits will enhance the historic context, going back to the Revolutionary and Civil wars, and exploring the Marines’ recent involvement in conflicts in the Balkans, Kuwait, Iraq, and Afghanistan. There are plans for an IMAX theater, offices, a small chapel for weddings and funerals, and a hotel and conference center elsewhere on the site. In anticipation of future expansion of the museum building, each exterior and interior concrete wall is a retaining wall. Museum operations won’t be interrupted for expansion, as work can begin on the other side of any of these retaining walls.

With innovative design—both inside and out—the National Museum of the Marine Corps brings history and tradition to life, living up to the message engraved over the museum’s entrance: “Enter and Experience What It Means To Be a Marine.”

The National Museum of the Marine Corps is a joint effort between the Marine Corps and the Marine Corps Heritage Foundation. For more information, visit www.usmcmuseum.org.

Figure 1

According to the U.S. Department of Energy (DOE), there are more than 226,000 manufacturing facilities in the United States. Most of these can economically benefit, to varying degrees, from proper insulation of their steam and process heating systems.

Heat is a key ingredient in the creation of almost all manufactured goods. At stake is valuable energy used to transform works in progress into final goods. Proper insulation of industry’s mechanical systems is therefore a central strategy for conserving energy—and money—that otherwise would disappear, literally, into thin air.

Accurate measures of the potential market for mechanical insulation are difficult to develop. Most steam-facility managers lack the time and motivation to take inventory of their facilities’ current insulation profiles. In other words, they have no idea how their current insulation usage compares to an economically optimal level. Even if facilities do maintain such inventories, the results are regarded as confidential.

Perennial questions about the mechanical insulation market may include:

  • How many facilities (and which ones) can benefit from improved insulation?
  • What are specific patterns in the under-application of insulation?
  • What is the distribution of economic opportunities for insulation improvements? (For example, what proportion of insulation-improvement opportunities represents contracts under $10,000? Over $100,000?)
  • What is the range of financial paybacks provided by typical insulation improvements?

Definitive answers to these questions remain elusive. However, diligent observers can get a limited view of the insulation market through energy assessments (audits) published by the DOE, whose Save Energy Now (SEN) program is conducting energy assessments for many of the largest industrial facilities in the United States. The DOE began promoting these assessments in the wake of the 2005 hurricane season, which disrupted energy markets. U.S. industrial profitability was severely threatened by dramatic spikes in the price of natural gas and other forms of energy. In an unprecedented policy initiative, the DOE offered free energy assessments on a first-come, first-served basis to facilities that applied for assistance and met eligibility criteria.

The DOE’s energy assessments investigate many energy-saving opportunities, not just insulation. Common assessment recommendations also include combustion tune-ups, steam-trap improvements, condensate return, and changes in operating procedures. Participating companies got a detailed, confidential assessment, while a “sanitized” version (with confidential information removed at the recipient’s discretion) was developed for publication. In 2006, 200 such assessments are being produced, with an additional 250 to be delivered in 2007.

The initial facilities reviewed included a wide variety of industries and locations. The first 53 facility assessments (through September 2006) are posted on the DOE’s website, www.energy.gov. This first batch of assessments was studied for this article, with a particular focus on insulation recommendations. Insulation opportunities were recorded in 27 (or 51 percent) of the assessments. The facilities that received insulation-improvement recommendations are listed in Table 1.

While each report is enlightening, the collection is not compiled consistently. This is because participating companies enjoyed editorial power over what information would be included in the published versions of their reports. Here are examples from reports where some estimates of savings attributable to insulation improvements are included (savings estimates were calculated using fuel prices that prevailed when the assessments were conducted):

  • The Boise Cascade report (ESA-006) estimates cost and energy savings due to insulation improvements. The estimated cost for all insulation improvements at this site is $25,000, and related savings should be $80,000 per year. One project—500 feet of piping that supplies 160°F feedwater to a deaerator—would cost about $12,000 and reduce annual energy losses by about $40,000.
  • An insulation survey of the National Starch & Chemical Co. power plant (ESA-029) in Indianapolis, Indiana, covered piping only, but revealed opportunities to save a total of $25,000 per year, at a cost of about $7,000.
  • Goodyear’s production facility (ESA-031) in Union City, Tennessee, features a number of partially insulated process units. Insulation upgrades are estimated to save $402,000 per year, and could be achieved at a cost of $80,000 to $200,000.
  • Sterling Chemical’s facility (ESA-074) in Texas City, Texas, can potentially save $123,000 a year through improved pipe insulation.
  • Dow’s Hahnville, Louisiana, facility (ESA-103) can save 81,100 MMBtu (million British thermal units) in annual natural gas consumption, or $81,000, by improving steam-system insulation.
  • The General Motors facility (ESA-138) in Pontiac, Michigan, features opportunities to repair and replace missing insulation, yielding estimated annual savings of $298,000.
  • Bayer CropScience’s steam facilities (ESA-142) in Institute, West Virginia, feature opportunities to replace or repair insulation on steam distribution and condensate return lines. The annual savings due to these improvements is estimated to be $926,000.

The assessments give an idea of industrial insulation potential.

While the DOE assessments did not consistently estimate the cost and savings impact of recommendations, the findings were at least classified as “near-term,” “medium-term,” or “long-term” opportunities, defined as follows:

  • Near-term: Improved operating or maintenance practices that could be performed at relatively low cost. These activities could typically be accomplished in a time frame of less than a year.
  • Medium-term: Improvements that require the purchase of additional equipment and/or changes in facility systems. These activities would also require additional engineering analysis, and they could be carried out in a 1- to 2-year time frame.
  • Long-term: Opportunities that involve the testing of new technologies and confirmation of their performance in the context of the subject plant’s operating conditions and investment criteria. These activities might be accomplished in a 2- to 5-year time frame.

By these definitions, about 82 percent of all insulation recommendations were near-term opportunities. Fifteen percent were described as medium-term opportunities, with the remainder being long-term opportunities.

Insulation costs were calculated in only a few of the assessment reports. Two recommendations were priced at $10,000 or under. One fell in the range of $10,000 to $80,000. One project was estimated to cost $80,000 to $200,000. These observations are insufficient to make robust generalizations about the overall value of potential mechanical-insulation contracts. However, the following interesting conclusions can be made even from this limited study:

  • About half of all these assessments recommended some form of insulation improvement. If this proportion applies to the entire population of U.S. industrial facilities, approximately 113,000 facilities would benefit from insulation improvements.
  • Even companies with award-winning energy-management programs had room for improvement. Some good examples are 3M Worldwide (ESA-001); J.R. Simplot (ESA 002); and Rohm & Haas Company, owners of the Morton Salt facility (ESA-004).
  • Remedial improvements to already-existing insulation represent a significant share of investment opportunities. In fact, this was the most frequently cited opportunity (over a third of all insulation recommendations).
  • Insulation is predominant among “quick-and-easy” energy-saving opportunities. Over 80 percent of all of the insulation-improvement recommendations made were near-term opportunities that would be achievable in less than 1 year.

The DOE continues to publish energy assessments generated by its Save Energy Now program. The DOE is continuing the program into 2007, which will make even more reports available for analysis. A more thorough description of the DOE’s Save Energy Now program, as well as information on its assessments and plans for future activity, can be found at www.eere.energy.gov/industry.

Figure 1
Figure 2